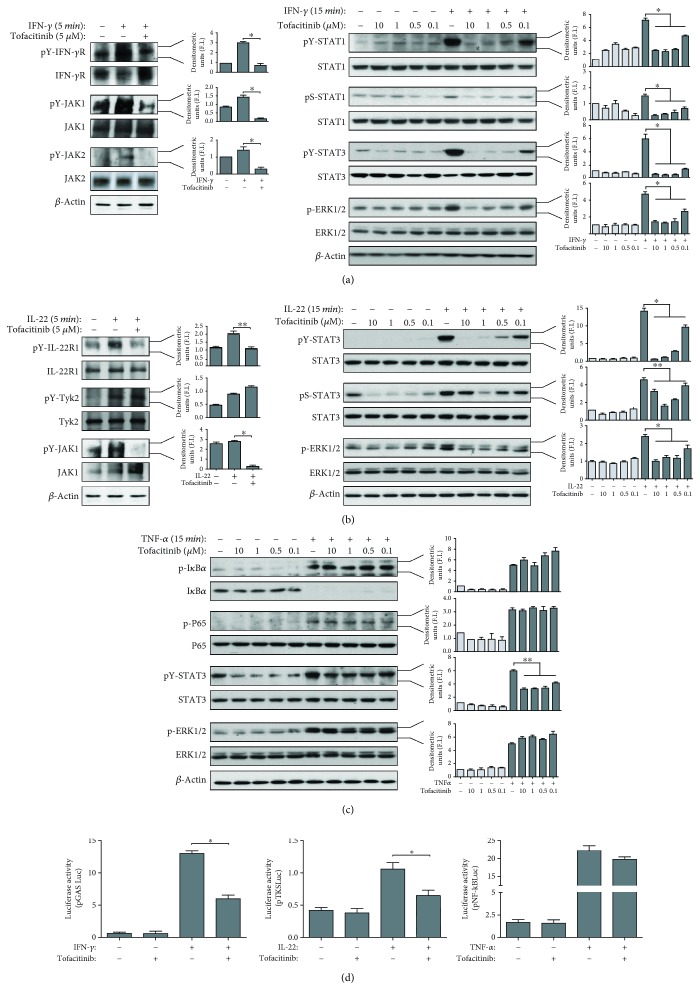
Figure 1.
Tofacitinib inhibits IFN-γ- and IL-22- but not TNF-α-induced molecular signaling in psoriatic keratinocytes cultures. (a) Protein extracts obtained from psoriatic keratinocytes pretreated or not with vehicle alone or the indicated doses of tofacitinib, and then stimulated or not with IFN-γ for the indicated time periods, were subjected to immunoprecipitation for IFN-γRα, JAK1, or JAK2 and Western blotting analysis by using anti-phosphotyrosine Ab to detect IFN-γRα, JAK1, or JAK2 phosphorylation. Filters were stripped and reprobed with anti-IFN-γRα, JAK1, or JAK2 Abs. Phosphorylated and unphosphorylated forms of STAT1, STAT3, and ERK1/2 were monitored in keratinocytes by WB analysis. (b) Protein extracts were obtained from keratinocytes pretreated or not with tofacitinib in the presence of IL-22 for the indicated time periods and were subjected to immunoprecipitation for IL-22R1, TYK1, or JAK2 and, then, WB analysis by using anti-phosphotyrosine Ab to detect IL-22R1, TYK1, or JAK2 phosphorylation. Filters were stripped and reprobed with anti-IL-22R1, TYK1, or JAK2 Abs. Phosphorylated and unphosphorylated forms of STAT1, STAT3, and ERK1/2 were also monitored in keratinocytes by WB analysis. (c) Protein extracts were obtained from keratinocytes pretreated or not with tofacitinib in the presence of TNF-α for 15 min and then analysed by WB analysis to detect basal or phospho-IκBα, basal or phosphor-p65 subunit of NF-κB, and phosphorylated and unphosphorylated forms of STAT3 and ERK1/2. Graphs in (a), (b), and (c) represent densitometric analyses of the indicated proteins shown in representative WB. Data are expressed as mean ± SD fold induction (F.I.) calculated relatively to the untreated samples, which were given a value of 1. ∗p < 0.01, ∗∗p < 0.05. (d) Psoriatic keratinocyte cultures transiently transfected with a STAT1-, STAT3-, or NF-κB-responsive plasmids, termed, respectively, pGAS-Luc, pLucTKS3, or pNF-κB-Luc were treated with 5 μM tofacitinib or vehicle alone for 2 h and then stimulated with IFN-γ, IL-22, or TNF-α for 8 h prior to assay Firefly luciferase activity on cellular extracts. Data are expressed as Firefly luciferase values normalized to Renilla luciferase and micrograms of proteins and are shown as mean + SD of n = 6 samples pooled from two experiments. ∗p < 0.01.

