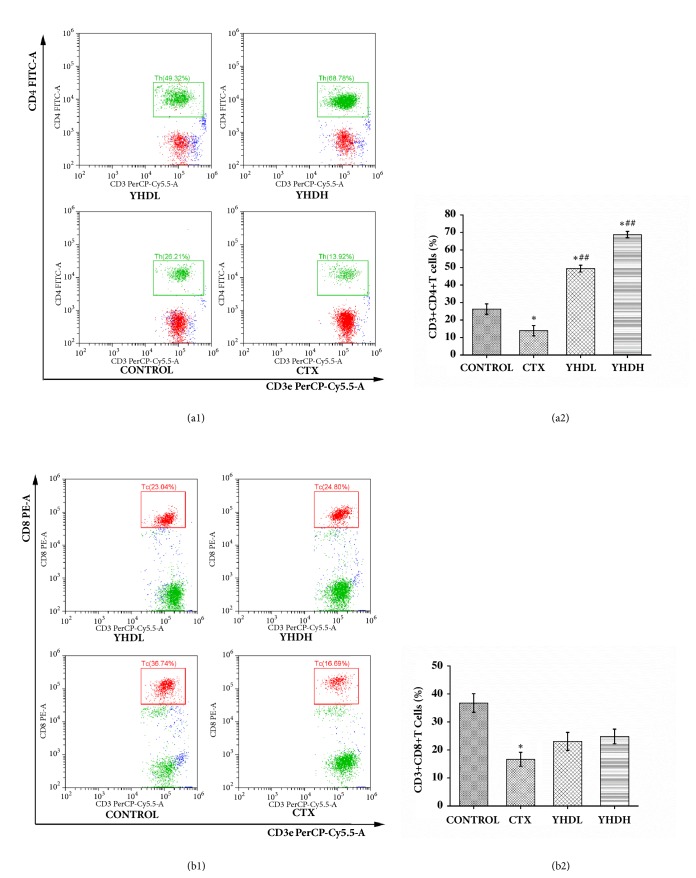
Figure 4.
The number of T cells subsets in tumor microenvironment detected by flow cytometry. (a1) The results of FCM on the number of CD3+CD4+T cells. (a2) The number of CD3+CD4+T cells. The bar chart indicated the opposite effect of CTX and YHD on CD3+CD4+T cells in the tumor tissue. (b1) The results of FCM on the number of CD3+CD8+T cells. (b2) The number of CD3+CD8+T cells. The bar chart indicated inhibition effect of CTX on CD3+CD8+T cells. Data were expressed as the mean ± SEM of 3 experiments (∗p < 0.05 compared with the control group; ##p < 0.01 compared with the CTX group).

