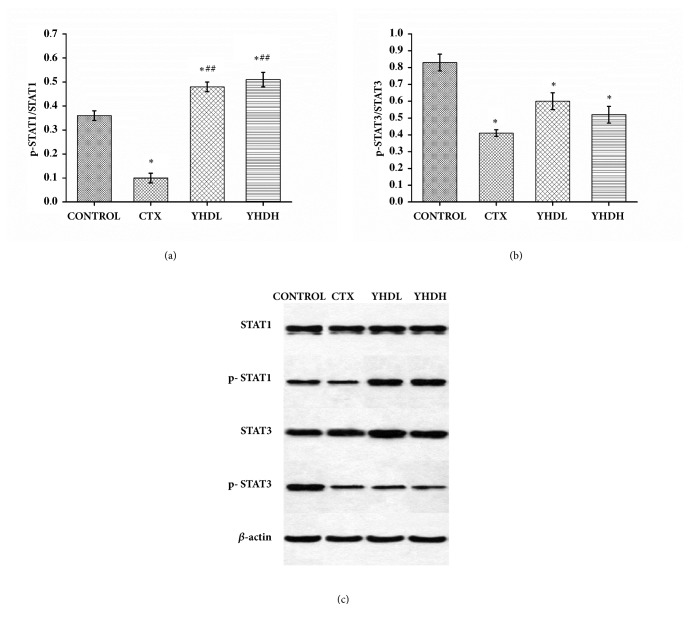
Figure 7.
The expression of p-STAT1, STAT1, p-STAT3, and STAT3 in tumor tissue detected by western blot. (a) The expression of p-STAT1/STAT1. (b) The expression of p-STAT3/STAT3. (c) The protein expression of p-STAT1, STAT1, p-STAT3, and STAT3. Data are expressed as the mean ± SEM of 3 experiments (∗p < 0.05 compared with the control group; ##p < 0.01 compared with the CTX group).

