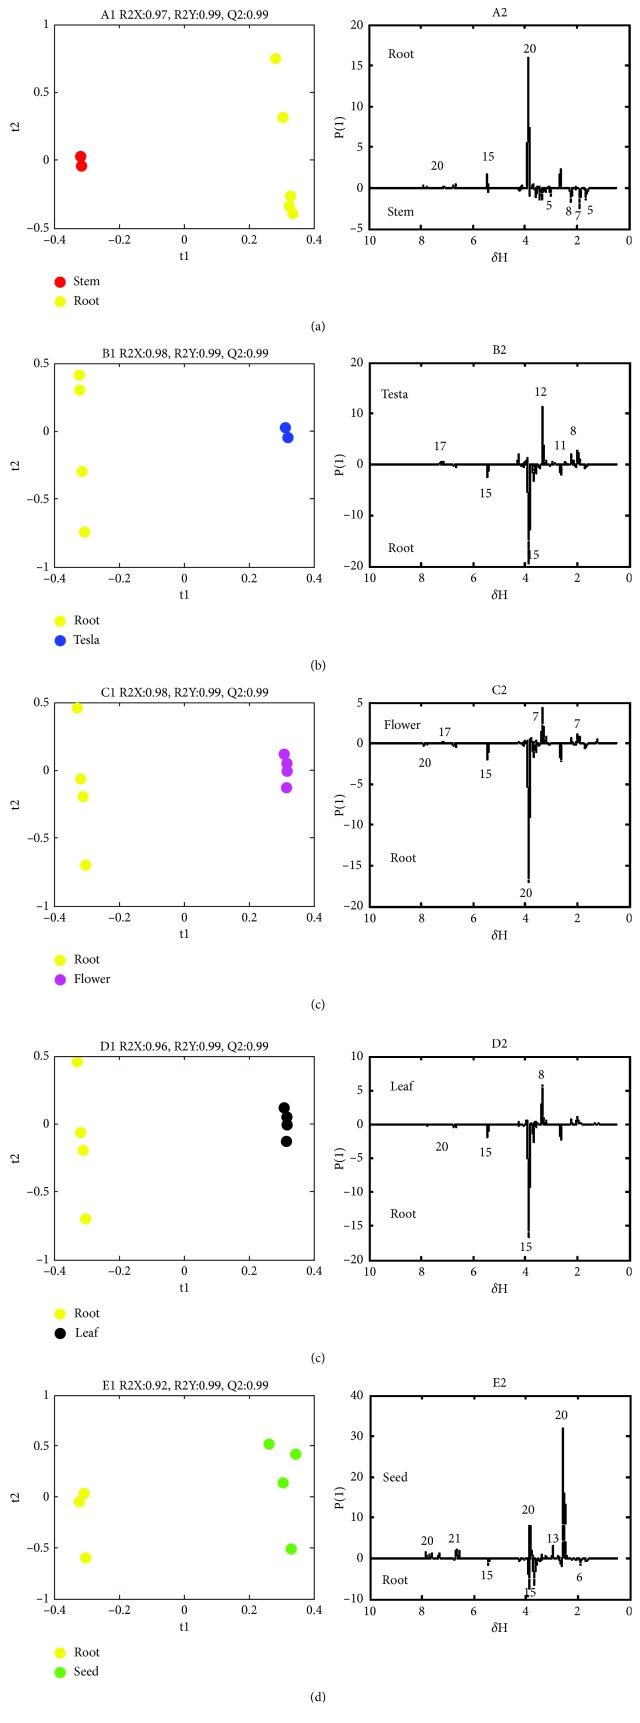
Figure 3.
PLS-DA score plot (A1-E1) and linear loading plot (A2-E2) of the methanol extracts of the different P. harmala parts (“red,” “yellow,” “blue,” “green,” “magenta,” and “black” dots represent the methanol extracts of the stem, root, testa, seed, flower, and leaf of the plant, respectively; t1 and t2 are the scoring points for the first and second principal components, respectively; δ H is the 1H-NMR chemical shift; P[1] is the loading point of the first principal component. The numbers represent different metabolites, as shown in Table 2).

