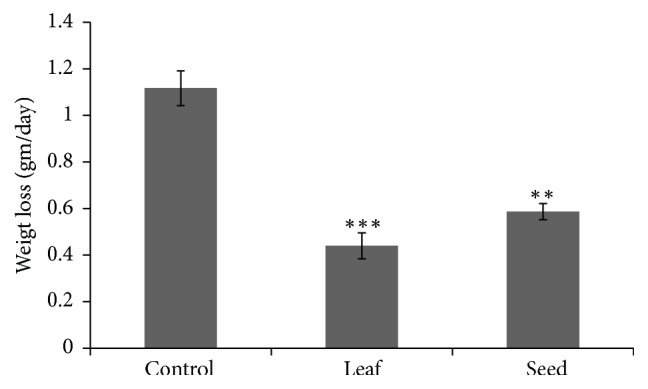
Figure 4.

Evaluation of weight loss in response to leaf and seed extract in Swiss Albino mice. Data expressed as mean ± SD (n = 6) for all tested dosages. Significant differences of values are compared to values of control with leaf and seed samples and marked as ∗p<0.05, ∗∗p<0.01, and∗∗∗p<0.001.
