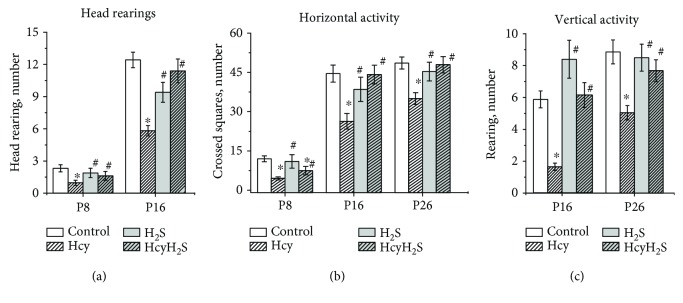
Figure 2.
Effects of maternal hyperhomocysteinemia and NaHS treatment on locomotion in the open field test. Head rearings (a), the number of crossed squares (b), rearings (c) of pups from the control Hcy, H2S, and HcyH2S groups. Data are expressed as mean ± SEM. ∗p < 0.05 compared to the control group; #p < 0.05 compared to the Hcy group.

