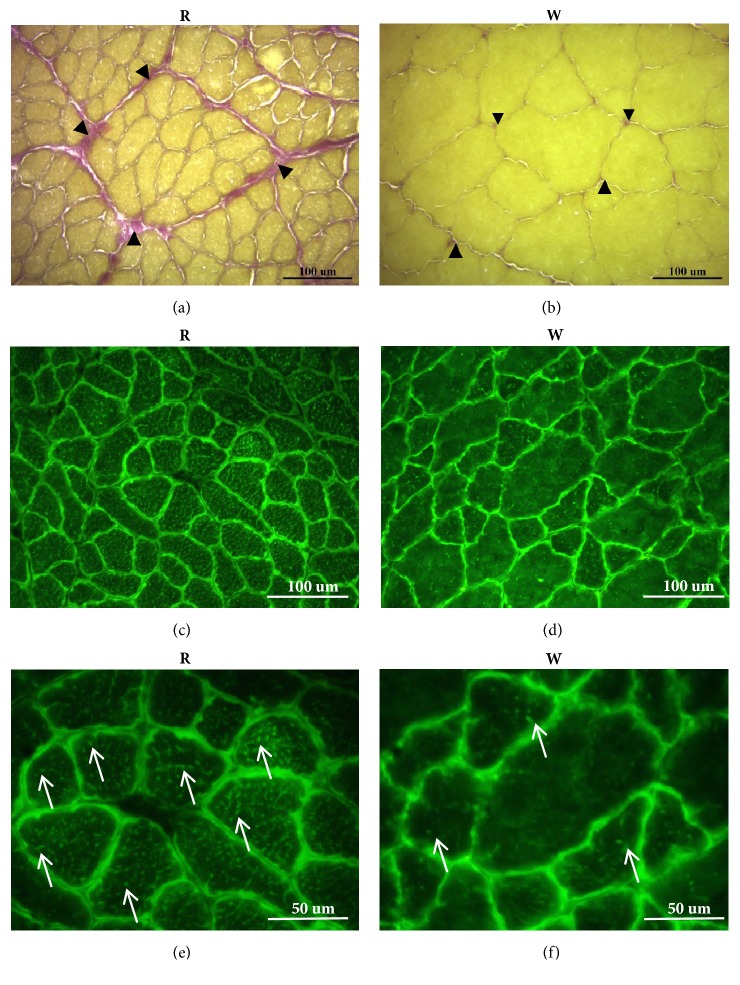
Figure 4.
Elastica-van Gieson (EVG) and Mito-Tracker Green FM staining to, respectively, detect connective tissues and mitochondria. (a) and (b) EVG staining labeled connective tissue between muscle fibers. Collagen fibers are red, and elastic fibers are purple. There was more connective tissue (arrowheads) between muscle fibers in red muscle (R) than white muscle (W). In addition, the size of red muscle fibers was smaller than that of white muscle fibers. (c–f) Mito-Tracker Green FM staining to label intracellular mitochondria. (c) and (e) show the mitochondrial distribution images of red muscle. (d) and (f) show the mitochondrial distribution images of white muscle. There was a high density of green fluorescence surrounding each muscle fiber in both muscles, indicating that abundant mitochondria were located beneath the sarcolemma. In addition, more green dots or trabecula (arrows) were found in red muscle fibers than in white muscle fibers ((e) and (f)), indicating that more-abundant mitochondria were located between myofibrils in red muscle than in white muscle.

