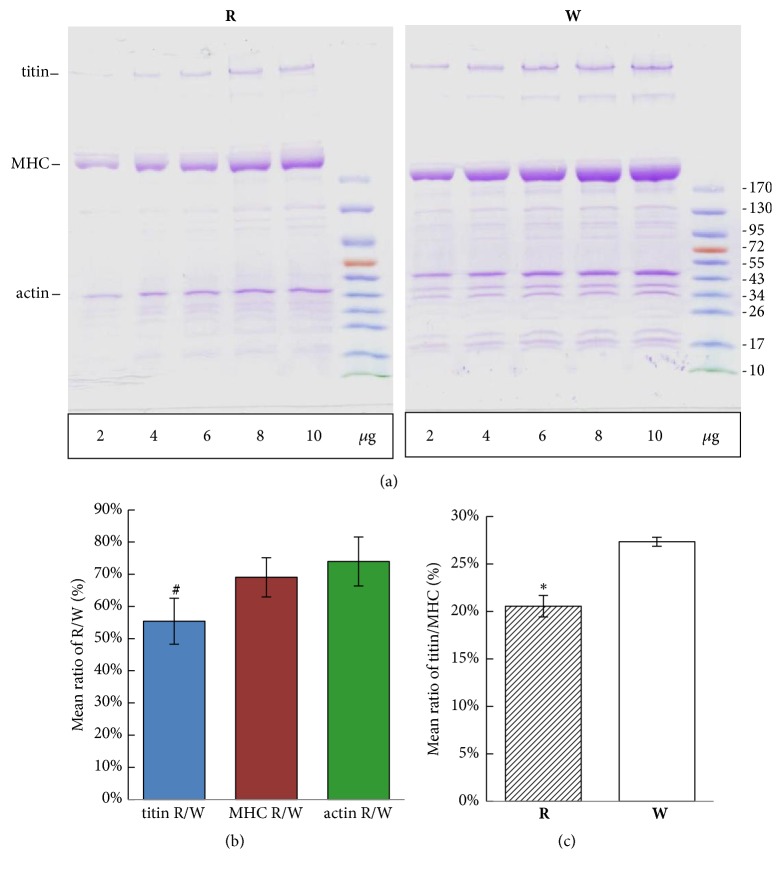
Figure 6.
SDS-PAGE protein analysis of red (R) and white (W) muscles. (a) After loading equal concentrations (2~10 μg) of total proteins, white muscle displayed more myofibrillar proteins than did red muscle. Titin, myosin heavy chain (MHC), and actin were the three major myofibrillar proteins. (b) Ratios of titin, MHC, and actin in red muscle to white muscle. (c) Mean ratios of titin/MHC in red and white muscles. # p < 0.01, ∗ p < 0.001.

