Figure 1.
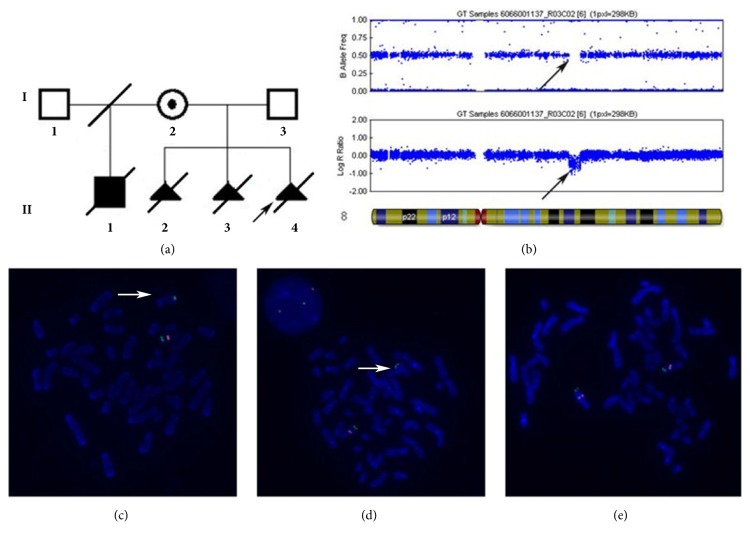
Pedigree of the family, microarray analysis, and FISH results. (a) Pedigree of the family. The arrow indicates the index fetus. Filled black symbols indicate the affected subjects. II:2, II:3, and II:4 were all male. (b) Plots of the copy number for individual SNP loci along chromosome 8 by Illumina HumanCytoSNP-12 BeadChip, showing a 4.9Mb (nt:82517136-87441476) heterozygous deletion 8q21.13-q21.3 in the fetus. Black arrow points to the deletion region. (c, d) FISH results of the index fetus and his mother. RP11-7N21 (red) mapped to the deletion region of 8q21.2 was used as the purpose probe, while RP11-714N16 (green) mapped to 8q24.3 as the control probe. Images showed no red signal onto the abnormal chromosome 8 in the metaphase cells of the index fetus (c) and the mother (d). (e) FISH result of the father. There are two signals of both red and green probes in the metaphase chromosome of the father (I:3).

