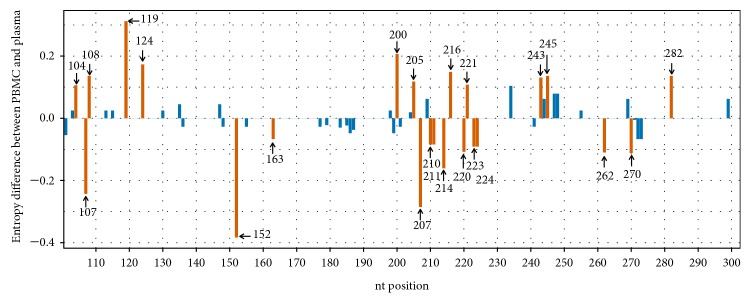
Figure 2.
Entropy differences between the PBMC and plasma. Entropy differences between sequences (nt 100 to 300 of the HCV IRES) derived from PBMCs (n=225) and plasma (n=225). Each bar represents the entropy difference at a single nucleotide position. Significant differences between the entropy of PBMC and plasma are indicated by orange bars while no significant differences are indicated by blue bars. The results were generated using a Perl script and the figure was produced in R software programming language.

