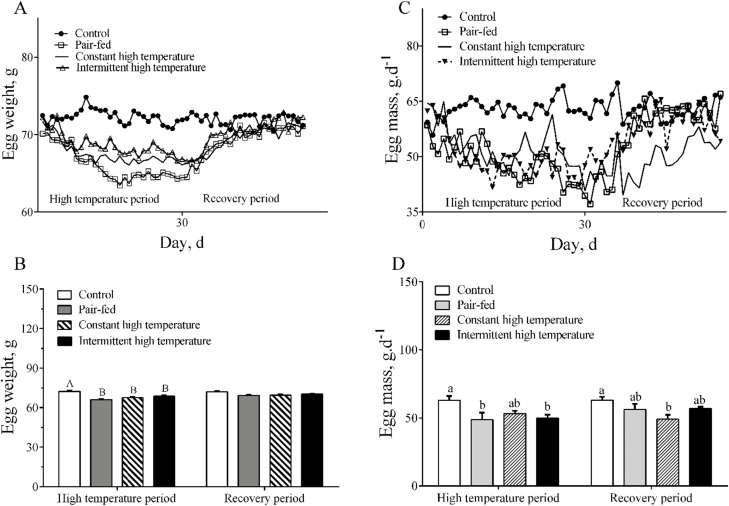
Figure 2.
Egg weight and egg mass of laying ducks during the period of high temperature and recovery. (A) Changes in egg weight; (B) statistical results of egg weight among treatments; (C) changes in egg mass; (D) statistical results of egg mass among treatments. Data are means ± SEM, n = 6 for each treatment. Different letters indicate significant difference at the 0.001 probability level.

