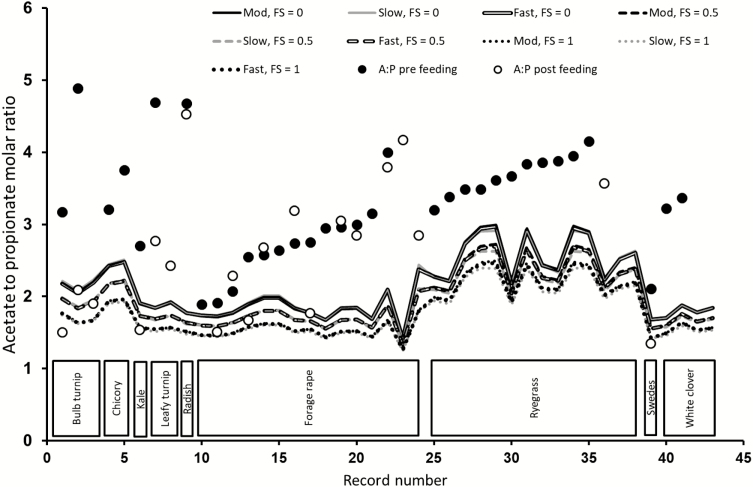
Figure 2.
Comparison of observed A:P ratios (prefeeding and postfeeding, solid and open circles, respectively) against MollyRum14 model predictions (lines) for sheep fed varying forages as sole diets, and the effect of substrate degradation rate (SLOW, MOD, or FAST) and FS (FS = 0 favors a more acetogenic fermentation), FS = 0.5 intermediate, and FS = 1 (favors a more propionogenic fermentation) used in the model calculations.

