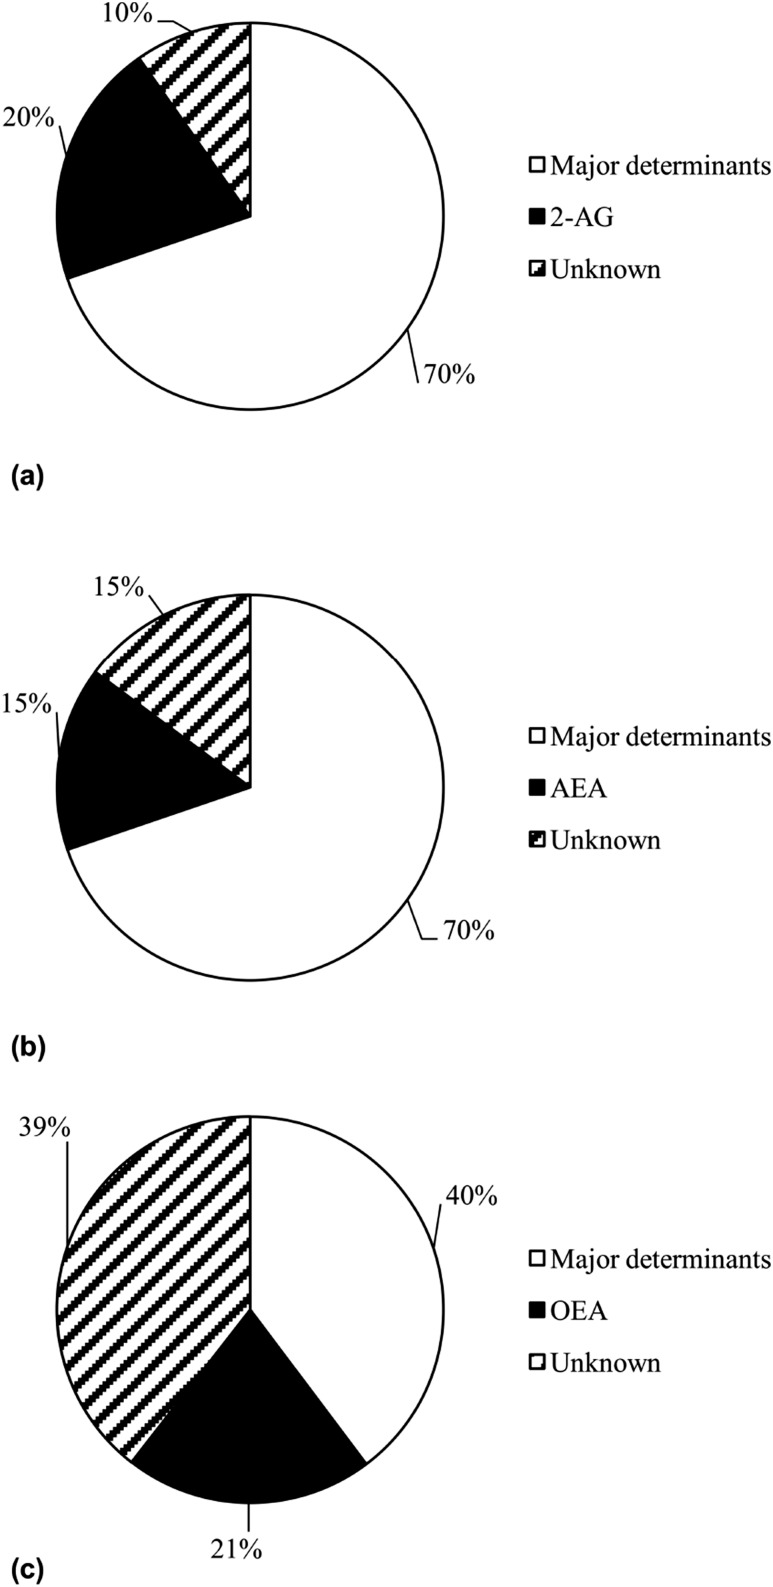
Figure 2.
Variance of EE measure explained by AEA, 2-AG, and OEA. Variance of (a, b) SLEEP and (c) 24-hour RQ explained by major known determinants (SLEEP: FFM, FM, age, and sex; for 24-hour RQ: percentage body fat, energy balance during indirect calorimetry, age, and sex) and skeletal muscle (a) 2-AG or (b) AEA concentrations, as well as adipose tissue (c) OEA concentration, respectively. Notably, due to our study group size, reported variance may differ from previous reports (27).

