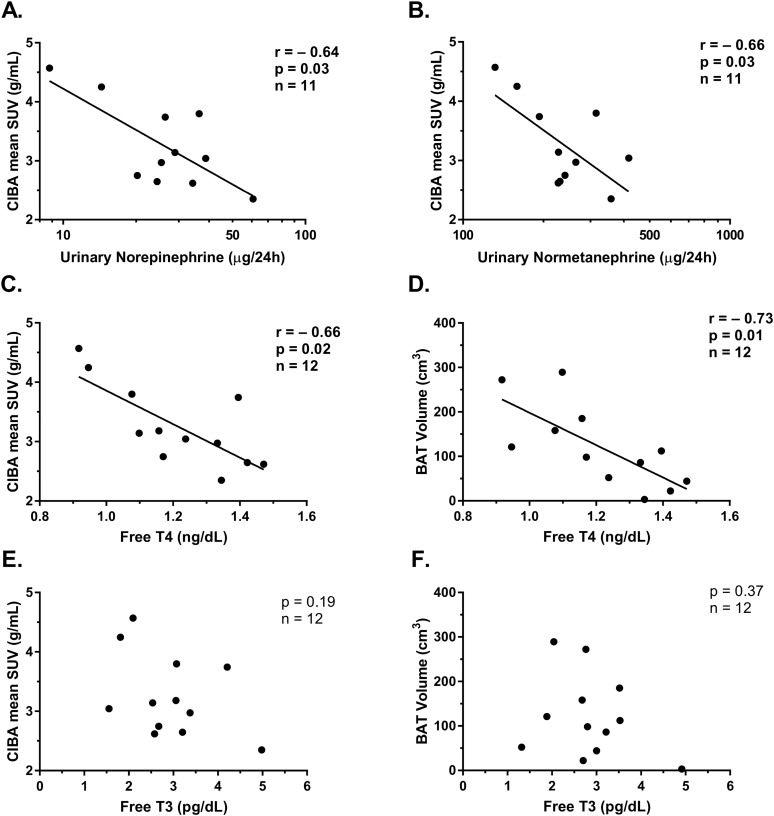
Figure 2.
Correlation between (A) CIBA mean SUV (g/mL) and urinary norepinephrine (µg/24 h) measured during EBL and thermoneutrality and (B) urinary normetanephrine (µg/24 h) measured by HPLC during EBL and thermoneutrality. Relationship between free T4 (ng/dL) and both (C) CIBA and (D) BAT volume. Lack of correlation between plasma free T3 (pg/dL) and both (E) CIBA and (F) BAT volume. Both free T4 and free T3 were measured fasting the morning after EBL diet and during thermoneutrality. Results remained similar after serial adjustment for age, sex, FM, or FFM.

