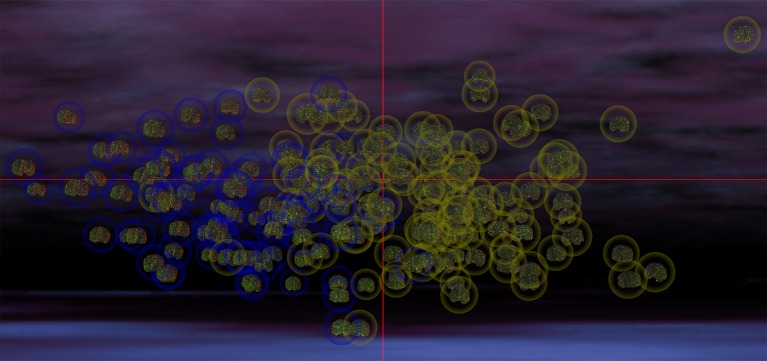
Figure 2.
MDS representation which illustrates the ability of structural brain variables to distinguish ASD patients from TD subjects. The cortical surface of each participant is shown, with the brains of participants belonging to each group being surrounded by a circle whose color indicates cohort membership (ASD in yellow, TD in blue). The spatial coordinates of each brain are specified by the MDS projection of each volunteer's brain structure descriptors from a hyperspace containing all descriptive variables to 3D space. Each coordinate axis in this 3D representation corresponds to each of the first three MDS eigenvectors of the matrix YYT (see Methods), accounting for the largest amount of variance in the data. In this representation, any pair of subjects whose brains are located farther apart from each other differ more in their structural features than pairs of subjects whose brains are closer. The excellent separation between the two cohorts is apparent due to the clustering of ASD patients away from the cluster of TD subjects. The visualization was produced within the INVIZIAN software package (Bowman et al., 2012).

