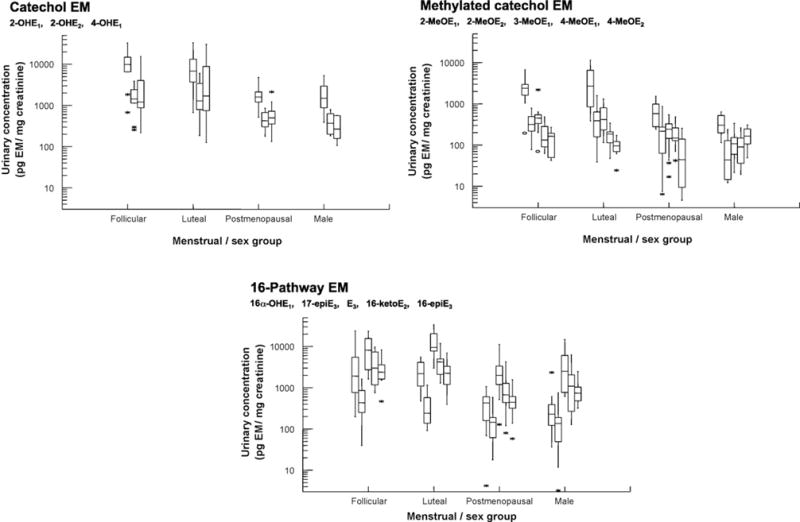
Fig. 3.

Interindividual variation in urinary concentrations of catechol estrogens and estrogen metabolites (EM), methylated catechol EM, and 16-pathway EM is shown with box plots for 10 premenopausal follicular phase women, 10 premenopausal luteal phase women, 15 postmenopausal women, and 10 men. Urinary EM concentrations are in pg/mg creatinine and presented on a logarithmic scale. The first graph summarizes interindividual variation of the catechol EM, shown in the following order: 2-hydroxyestrone (2-OHE1), 2-hydroxyestradiol (2-OHE2), and 4-hydroxyestrone (4-OHE1). The second graph summarizes interindividual variation of the methylated catechol EM: 2-methoxyestrone (2-MeOE1), 2-methoxyestradiol (2-MeOE2), 2-hydroxyestrone-3-methyl ether(3-MeOE1), 4-methoxyestrone (4-MeOE1), and 4-methoxyestradiol (4-MeOE2).The third graph summarizes interindividual variation of the 16-pathway EM: 16α-hydroxyestrone (16α-OHE1),17-epiestriol (17-epiE3), estriol (E3), 16-ketoestradiol (16-ketoE2), and 16-epiestriol (16-epiE3). The horizontal line within each box is the median of the distribution. The top and bottom of each box are the interquartile range (75 and 25 percentiles, respectively) of the distribution. The vertical lines above and below each box extend to the extreme values that are not outliers (≤1.5 times the interquartile range). Outliers are represented as stars (>1.5 but ≤3 times the interquartile range) and open circles (>3 times the interquartile range).
