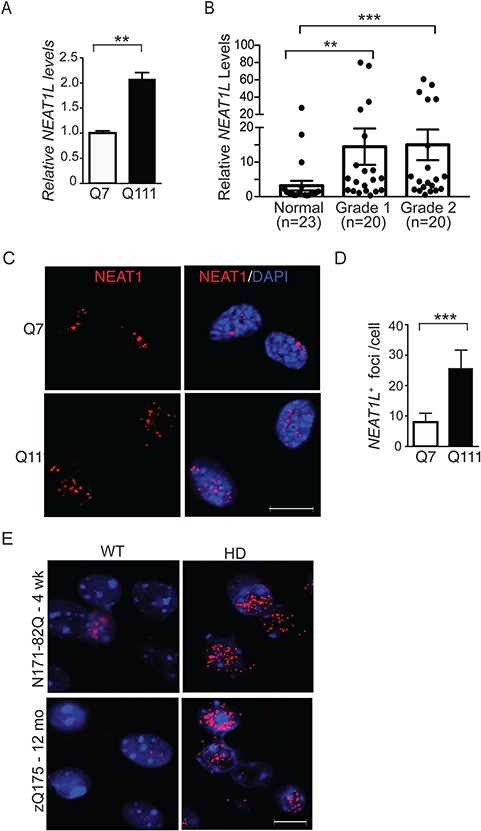
Figure 2.

NEATL levels are upregulated in HD models and patient brain tissue. (A) RT-qPCR analysis of NEAT1L transcript levels in differentiated Q7 and Q111 immortalized striatal neurons. Data represent mean ± SEM. Significance was determined by unpaired, two-tailed t-test. **P < 0.01, ***P < 0.001. A minimum of three biological replicates with triple technical replicates per experiment were done. (B) RNA was isolated from the BA9 region from control donors or HD patients that had been pathologically scored as Von Sattal grade 1 or 2. RNA levels were quantified by RT-qPCR. Data were normalized to control human samples. Significance was determined using the Kruskal–Wallis test with Dunn’s post hoc analysis. ns = not significant. (C and D) Representative images (C) and quantification (D) of Neat1L positive foci in Q7 and Q111 cells assessed by FISH. Scale bar = 10 μm. For statistical analyses of the Neat1L RNA foci, ∼120 differentiated striatal neurons were counted randomly under the microscope. All images of the same experiment were processed with the same excitation power and exposure time and processed similarly using ImageJ software (National Institutes of Health, Bethesda, MD). Data represent mean ± SEM. Significance was determined by unpaired, two-tailed t-test. ***P < 0.001. (E)Neat1L RNA-FISH in tissues collected from presymptomatic 4-week-old N171-82Q mice (upper panels) and symptomatic 12-month-old zQ175 mice (lower panels). Scale bar = 10 μm.
