Figure 4.

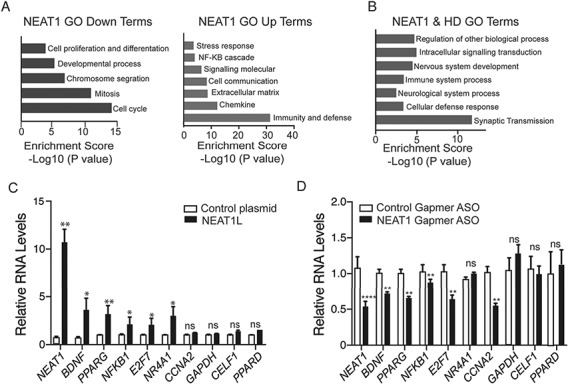
Evaluation of Neat1-KD and mHTT-induced transcriptional pathways. (A) RNA-Seq data from Neat1L knockout mouse embryonic fibroblasts was analyzed by PANTHER (Protein ANalysis THrough Evolutionary Relationships, http://pantherdb.org) using default settings to evaluate pathways affected by the absence of Neat1L in down-(left) or up-(right) regulated gene sets. (B) Overlapping GO analysis terms derived from the RNA-seq data sets from Neat1L knockout mouse embryonic fibroblasts and HD patient-derived iPSC lines. (C) Genes reported beneficial to HD cells increase with NEAT1 overexpression. Plasmids overexpression NEAT1L or GFP were transfected into neural N2A cells and the RNA levels of the indicated genes assessed by RT-qPCR 24 h later (n = 6 biological replicates with two or three technical replicates). ACTB was used as a reference gene, with data normalized to control plasmid-transfected cells. Data are mean ± SEM and significance determined by Mann–Whitney two-tailed t-test for all comparisons. *P < 0.05, **P < 0.01; ns = not significant. (D) Genes compromised in HD are repressed by NEAT1L knockdown. SH-SY5Y cells were transfected with control Gapmer ASOs or NEAT1L specific Gapmer ASOs. Twenty-four hours post transfection, RNA was harvested and transcript levels quantified by RT-qPCR. Data were normalized to the control ASO-treated group (n = 6 biological replicates, performed in triplicate). β-Actin was used as a reference gene. Data are mean ± SEM with significance determined Mann–Whitney two-tailed t-test for all comparisons. *P < 0.05, **P < 0.01; ns = not significant.
