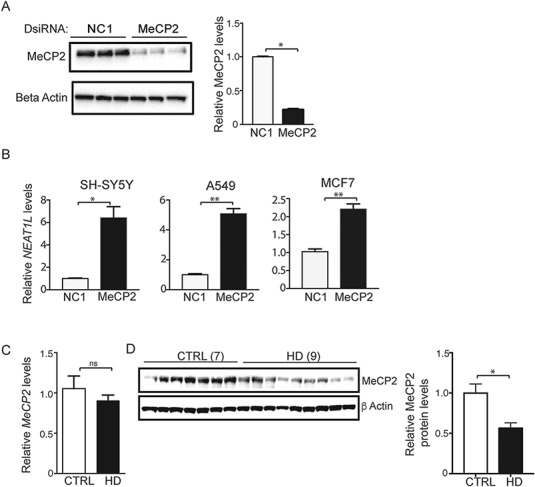
Figure 6.

NEAT1L is repressed by MeCP2. (A) Immunoblot analysis of MeCP2 knockdown in SH-SY5Y cells. β-Actin was used as loading control. Right panel, quantification after densitometry of blots. N = 3 biological replicates with three technical replicates. Data are mean ± SEM with significance determined by Mann–Whitney two-tailed t-test, *P < 0.05. (B)NEAT1L RNA levels after MeCP2 knockdown in SH-SY5Y, A549 or MCF7 cells. Data are normalized to HPRT1 and control dsiRNA-treated cells (n = 3 biological replicates with three technical replicates). Data are mean ± SEM with significance determined by unpaired, two-tailed t-test with Welch’s correction, *P < 0.05; **P < 0.01. (C) RT-qPCR analysis of MeCP2 mRNA levels in human brain samples (BA9) from normal (7) and HD (9) individuals. Data are mean ± SEM and are normalized to HPRT1. Significance was determined by Mann–Whitney two-tailed t-test, ns = not significant. (D) Left panel, Representative western blot for MeCP2 protein levels in human brain samples from normal (n = 7) and HD patients (n = 9). β-Actin was used as loading control. Right panel, Quantification after densitometry of MeCP2 protein levels in human brain tissues using ImageJ software. Data are mean ± SEM and are normalized to MeCP2 protein level in control samples. Unpaired, two-tailed t-test with Welch’s correction. *P < 0.05.
