
Figure 4.
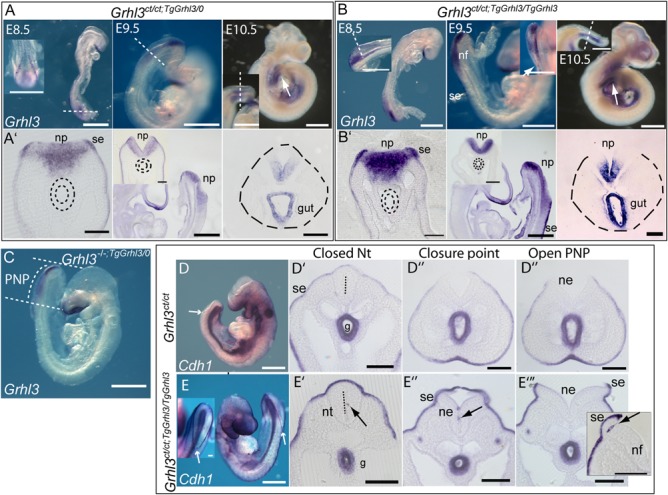
Overexpression of Grhl3 and Cdh1 in Grhl3-transgenic embryos. (A and B) Grhl3 expression in hemizygous (A) and homozygous (B) Grhl3-BAC transgenics detected by WMISH. Expression is detected in the expected domains in the surface ectoderm (se), neural plate (np) and hindgut (arrows in whole mounts; dotted lines in sections). Transverse sections are at the level of white dotted line on corresponding whole mount images; sagittal sections are shown at E9.5. (C) On a Grhl3-null background, the expression pattern of Grhl3 (entirely from the transgene), resembles the previously reported endogenous expression pattern. (D and E) Cdh1 shows the expected expression in surface ectoderm (se) and gut endoderm (g) in Grhl3ct/ct embryos (D). In Grhl3-transgenic embryos (E), Cdh1 expression appears more intense in the surface ectoderm (se) and occasional Cdh1-postive cells (arrows in E’-E”’) are present in the recently closed neural tube (nt; L) and the neuroepithelial component (ne) of the open neural folds (E”’, inset). Figure shows representative embryos at E9.5 (19–20 somite stage; D,E) with site of neural fold closure shown by white arrow in whole mounts. Scale bar = 0.5 mm in whole mounts; 0.1 mm in sections.