
Figure 1.
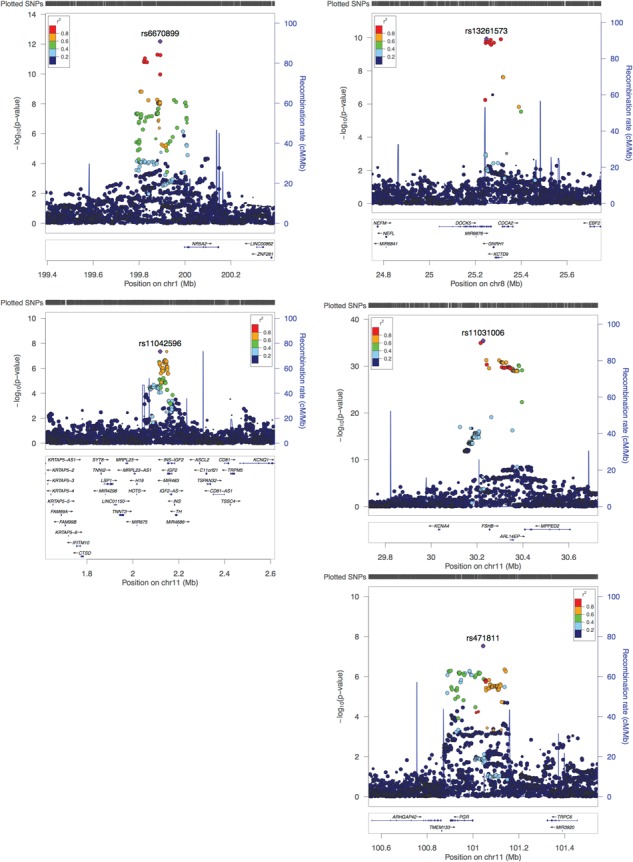
Regional plots for five genome-wide significant loci. Regional plot depicts SNPs plotted by their position and GWAS meta-analysis –log10 (P-value) for association with menstrual cycle length. Nearby genes are shown on the lower panel.
Official websites use .gov
A
.gov website belongs to an official
government organization in the United States.
Secure .gov websites use HTTPS
A lock (
) or https:// means you've safely
connected to the .gov website. Share sensitive
information only on official, secure websites.
Regional plots for five genome-wide significant loci. Regional plot depicts SNPs plotted by their position and GWAS meta-analysis –log10 (P-value) for association with menstrual cycle length. Nearby genes are shown on the lower panel.