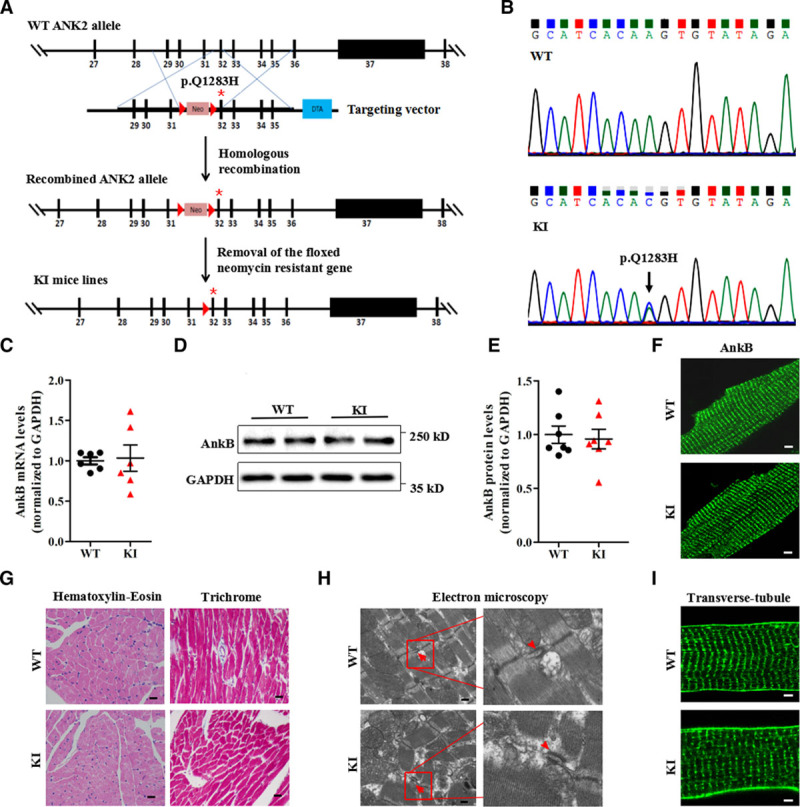
Figure 2.

Generation and evaluation of KI mouse models carrying the ANK2 p.Q1283H variant under basal conditions. A, Schematic diagram illustrating the targeting vector and step-wise generation of KI mouse models. B, DNA sequencing confirming the successful generation of KI mice carrying the p.Q1283H variant (lower, black arrow). C, Quantitative real-time PCR analysis of AnkB mRNA in sections of the ventricles of WT and KI littermates (n=6 hearts/genotype, P=0.85). D and E, Representative immunoblots (D) and quantitative assessment (E) of the protein expression level of AnkB in sections of the ventricles of WT and KI littermates (n=7 hearts/genotype, P=0.54). F, Representative immunostaining showing that cardiomyocytes from WT and KI mice display a normal subcellular distribution of AnkB. G, Representative images of hematoxylin-eosin staining (left; magnification ×400) and Masson’s trichrome staining (right; magnification ×400) of left ventricles from WT and KI mice. H, Representative electron micrographs of left ventricles from WT and KI mice (red arrowheads indicate the t-tubule lumen marked by the sarcoplasmic reticulum and t-tubule membranes of the triads). I, Representative immunostaining showing that cardiomyocytes from WT and KI mice display a normal t-tubule organization (stained with Di-8-ANEPPs). The data shown in F through I are representative of ≥3 hearts/genotype. AnkB indicates ankyrin-B; GAPDH, glyceraldehyde-phosphate dehydrogenase; KI, knockin; PCR, polymerase chain reaction; and WT, wild type.
