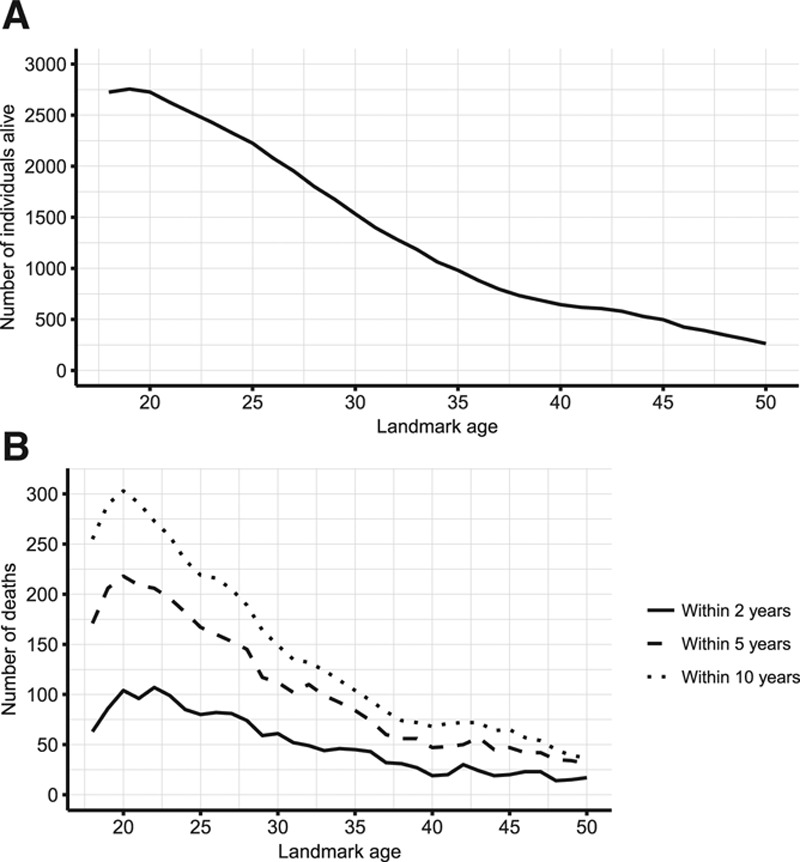
Figure 1.

Overview of number of individuals in each landmark data set. A, Number of individuals alive at each landmark age at any point during the study period. B, Number of deaths within 2, 5, and 10 years after each landmark age, among those alive at each landmark age.
