-
A
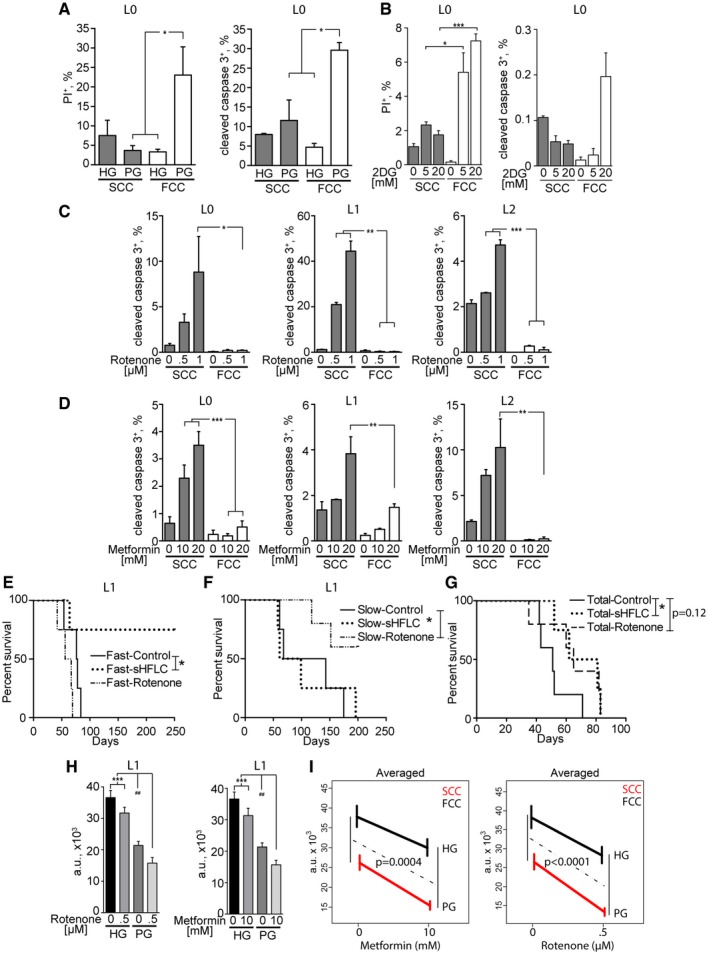
SCCs and FCCs were cultured in high glucose (HG, > 500 mg/dl) or physiological glucose (PG, 90–110 mg/dl) conditions for 24 h. Cell death was quantified by flow cytometry through propidium iodide (PI) incorporation (L0, n = 3–5) and cleaved caspase‐3 expression (L0, n = 2–3). *P < 0.05, 1‐way ANOVA.
-
B
SCCs and FCCs were cultured in 0, 5, or 20 mM 2‐deoxyglucose (2DG) for 24 h. Cell death was quantified by flow cytometry through propidium iodide (PI) incorporation (L0, n = 3) and cleaved caspase‐3 expression (L0, n = 3). *P < 0.05, **P < 0.01, 1‐way ANOVA.
-
C, D
Quantification of cleaved caspase‐3 and CellTrace signals in cultured hGBM cells after 24 h of treatment with rotenone (L0, n = 4–5; L1–L2, n = 3; L2) (C) or metformin (L0, n = 4; L1, n = 3–4; L2, n = 2) (D). *P < 0.05, **P < 0.001, ***P < 0.0005, one‐way ANOVA with Tukey post‐test.
-
E–G
Kaplan–Meier curves showing the survival of animals intracranially implanted with SCCs or FCCs (n = 4–5) and treated with rotenone (0.5 mg/kg) or fed with a glucose‐restricted/supplemented high‐fat, low‐carbohydrate diet (sHFLC; *P ≤ 0.05, log‐rank test).
-
H
The combinatorial effects of administering glucose restriction along with mitochondrial targeting with rotenone (n = 16, left) or metformin (n = 16, right) were measured using CyQUANT assays after 24 h of treatment (***P < 0.001, one‐way ANOVA with Tukey post‐test, ##
P < 0.01, t‐test).
-
I
Mean responses predicted by the generalized linear model (GLM). The effect of lowering glucose on cell viability (HG‐PG vertical differences) depended on the presence/absence of metformin or rotenone. F tests were used to measure the significance of the interactions between glucose and metformin or rotenone effects. Interaction P‐values are indicated.
Data information: Values are mean ± SEM.

