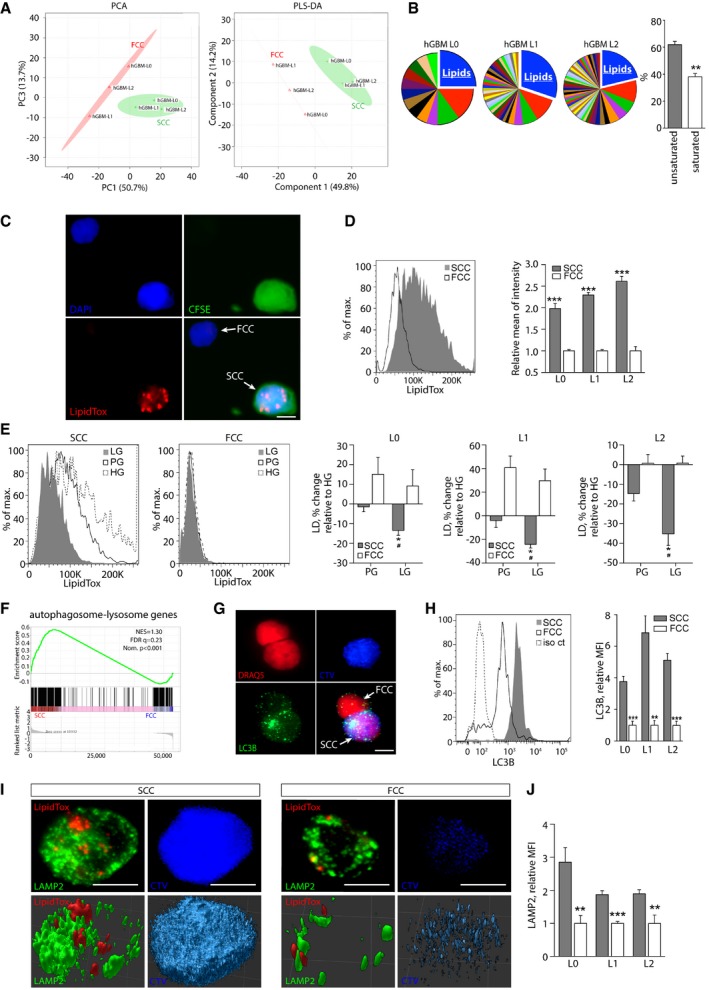
PCA and PLS‐DA score plots derived from UHPLC/HRQMS metabolomics. Green cross: SCCs; red triangle: FCCs.
Pathway analysis performed for each individual hGBM cell line revealed that lipids constitute the most represented metabolic intermediates that are up‐regulated in SCCs compared with FCCs. The majority of lipids up‐regulated in SCCs are unsaturated (mean ± SEM, n = 3, **P < 0.01, t‐test).
Representative fluorescence microscopy images of single cells showing lipid droplets that were detected using LipidTox (red). SCCs were identified with CFSE‐CellTrace (green). Nuclei were stained with DAPI (blue). Scale bar, 5 μm.
Flow cytometry quantification of lipid droplets in hGBM L0, L1, and L2 cell lines (mean ± SEM, n = 3–7, ***P < 0.001, t‐test).
Using flow cytometry, lipid droplet contents were compared between cells cultured for 24 h in high (HG), physiological (PG), or low (LG, 65–80 mg/dl) glucose conditions. Results are represented as average percent change relative to HG (mean ± SEM, n = 3 for all lines; *P < 0.05, t‐test compared to HG; #
P < 0.05, t‐test compared to PG).
GSEA of SCC (n = 3 biological replicates, L0‐1‐2) and FCCs (n = 3 biological replicates, L0‐1‐2) RNA seq data sets for enrichment of the autophagosome–lysosome pathway. FDR, false discovery rate; NES, normalized enrichment score; Nom., nominal.
Fluorescence microscopy images of LC3 (autophagosome marker) in CellTrace‐positive (blue) and negative cells. Nuclei were stained with DRAQ5 (red). Scale bar, 5 μm.
Quantification of LC3 by flow cytometry demonstrated greater amounts of autophagosomes in SCCs than in FCCs (mean ± SEM, L0, n = 4; L1, n = 4; L2, n = 7, **P < 0.01, ***P < 0.001, t‐test).
Confocal microscopy images of lipid droplets (LipidTox, red) and lysosomes (LAMP2, green) in a single SCC (CTVhigh, blue) and FCC (CTVlow). Top panels represent maximum z‐stack projections, and bottom panels show 3D reconstructions. Scale bar, 5 μm.
LAMP2 expression was measured and compared between SCCs and FCCs by flow cytometry (mean ± SEM, L0, n = 3; L1, n = 4; L2, n = 4, **P < 0.01, ***P < 0.001, t‐test).