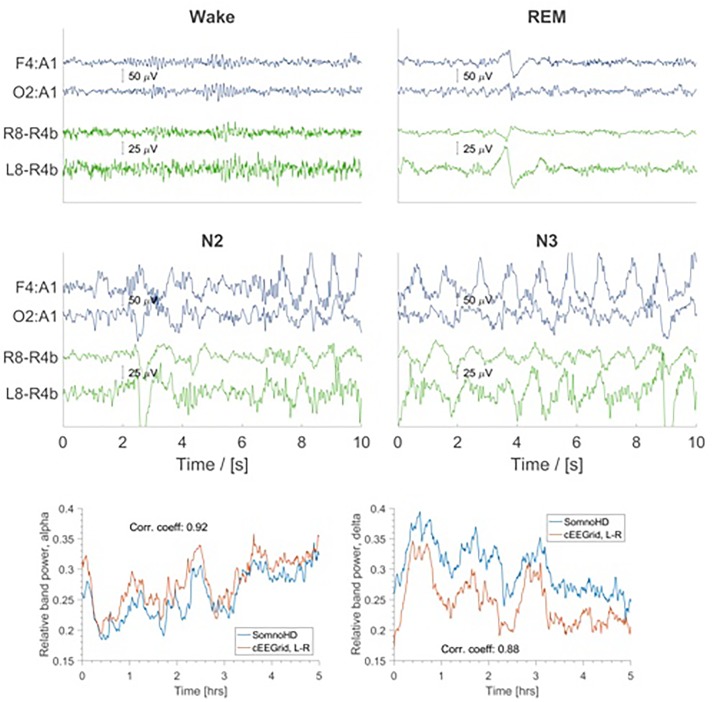
FIGURE 4.
Top four panels: EEG traces for SomnoHD (blue) and cEEGrid (green). Bottom panel: Average relative power in the alpha (8–16 Hz) and delta (1–4 Hz) frequency bands depicted for SomnoHD and cEEGrid. Not all subjects had 5 h worth of NREM recording, meaning that the number of subjects included in the average decreases with time.

