
Fig. 3.
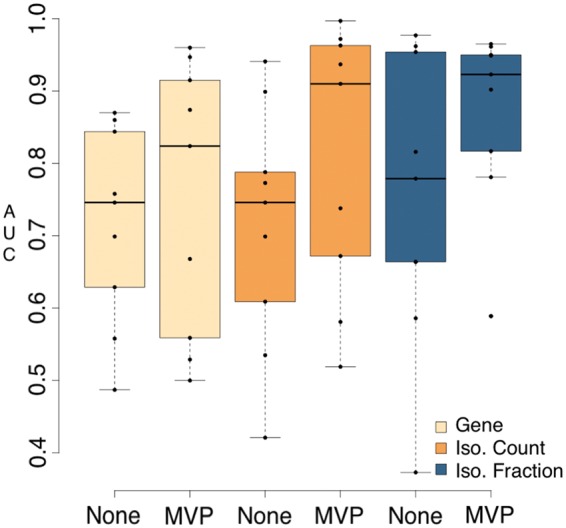
Predictive power of pipelines that use RSEM with varying feature types and filtering. AUC values were generated by running all input datasets (NSCLC, ALS, COPD) through nine pipelines that all performed transcript quantification with RSEM, but varied in feature type (gene, isoform count, isoform fraction), use of filtering and machine learning algorithm (Random Forest, Elastic Net, SPLS). Predictive values are shown grouped by feature type and whether filtering was applied