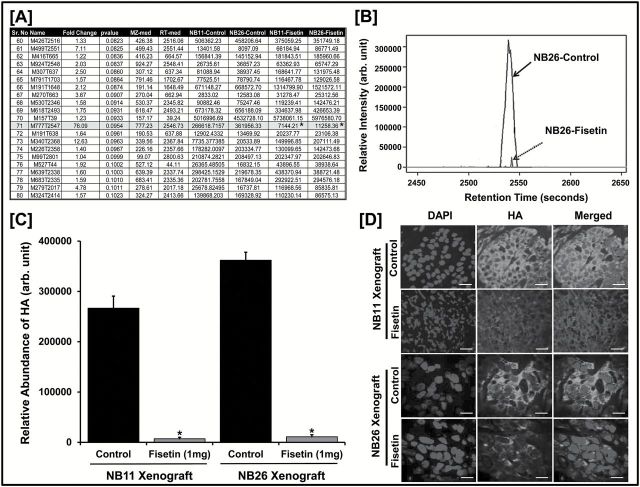
Figure 1.
Identification of HA as a unique target of fisetin. ( A ) Metabolites of NB11 and NB26 xenograft tissues with or without fisetin treatment ( n = 6 animals/group) analyzed using untargeted metabolomics (HPLC–ESI–MS) in positive-ion mode. A representative list of 20 metabolites identified from the METLIN database is shown; m/z = 776.25 was identified as HA (Student’s t -test; * P ≤ 0.1). For the complete list of metabolites, please see Supplementary Table 8 , available at Carcinogenesis Online (MS excel file). ( B ) HPLC separation (retention time = 2546.73) and relative intensity of HA metabolite peak identified in NB26 xenografts between control versus fisetin-treated animals. All six biological replicates showed similar analytical separation between the control and treated groups and a representative picture is shown. ( C ) Comparative plot of relative abundance of HA between control and fisetin-treated animal groups in NB11 and NB26 xenografts. Error bars represent mean ± SEM among six biological replicates (fisetin dose was 1mg/animal thrice weekly; * P ≤ 0.1). ( D ) Representative images showing immunofluorescence for HA between control and fisetin-treated NB11 and NB26 xenografts. Tumor tissues were harvested, and each of the six biological replicates was performed in triplicates for HA staining. Images were captured by a confocal microscope as described in Materials and methods. Scale bar, 30 µm. Magnification for NB11 xenograft images are at ×20 and for NB26 xenograft images at ×40. 4′,6-Diamidino-2-phenylindole (DAPI) was used as a nuclear staining control. Fluorescence intensity was measured and plotted (see Supplementary Figure 2 , available at Carcinogenesis Online).

