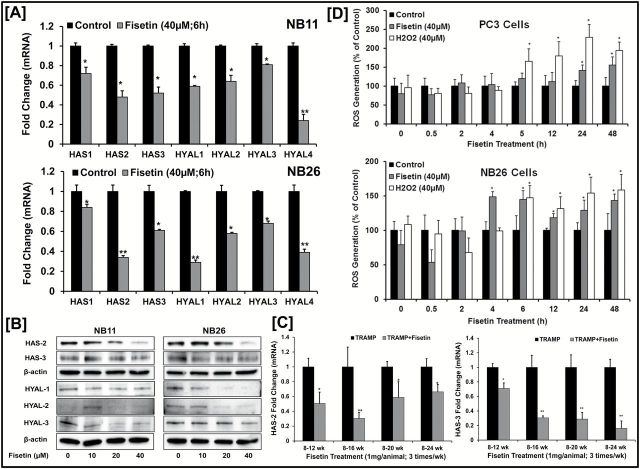
Figure 4.
Fisetin reduces HA synthesis and degradation enzymes both in vitro / in vivo . ( A ) Histograms represent relative HAS (1, 2 and 3) and HYAL (1, 2, 3 and 4) mRNA expression in NB11 and NB26 cells treated with or without fisetin (40 µM). Gene expression was measured at 6h by qPCR and normalized to housekeeping control, GapDH. Error bars represent mean ± SEM among three independent experiments, and each experiment was performed in triplicate. Statistical difference was seen in gene expression on fisetin treatment when compared with the respective control (* P ≤ 0.05, ** P ≤ 0.01). ( B ) Immunoblot images of NB11 and NB26 cells treated with or without increasing doses of fisetin (0–10–20–40 µM) for 48h and HAS (2 and 3) and HYAL (1, 2 and 3) protein expression were measured. Three independent experiments were performed, and each experiment was analyzed in triplicate. β-Actin was used as a loading control. Quantitative densitometry was analyzed and plotted (see Supplementary Figure 4 , available at Carcinogenesis Online). ( C ) Histograms represents relative HAS2 and HAS3 mRNA expression measured by qPCR in prostatic tissues of control and fisetin (1mg/animal thrice weekly) treated TRAMP animals with increasing age and PCa progression. 18sRNA was used as a housekeeping gene for normalization. Error bars represent mean ± SEM among three independent experiments, and each experiment was performed in triplicates (* P ≤ 0.05, ** P ≤ 0.01). ( D ) Histogram showing intracellular ROS generation levels (% control) with or without fisetin treatment (40 µM) in a time-dependent manner (0–0.5–2–4–6–12–24–48h). H 2 O 2 (40 µM) was used as a positive control. Error bars represent mean ± SEM among three independent experiments, and each experiment was performed in triplicate (* P ≤ 0.05).

