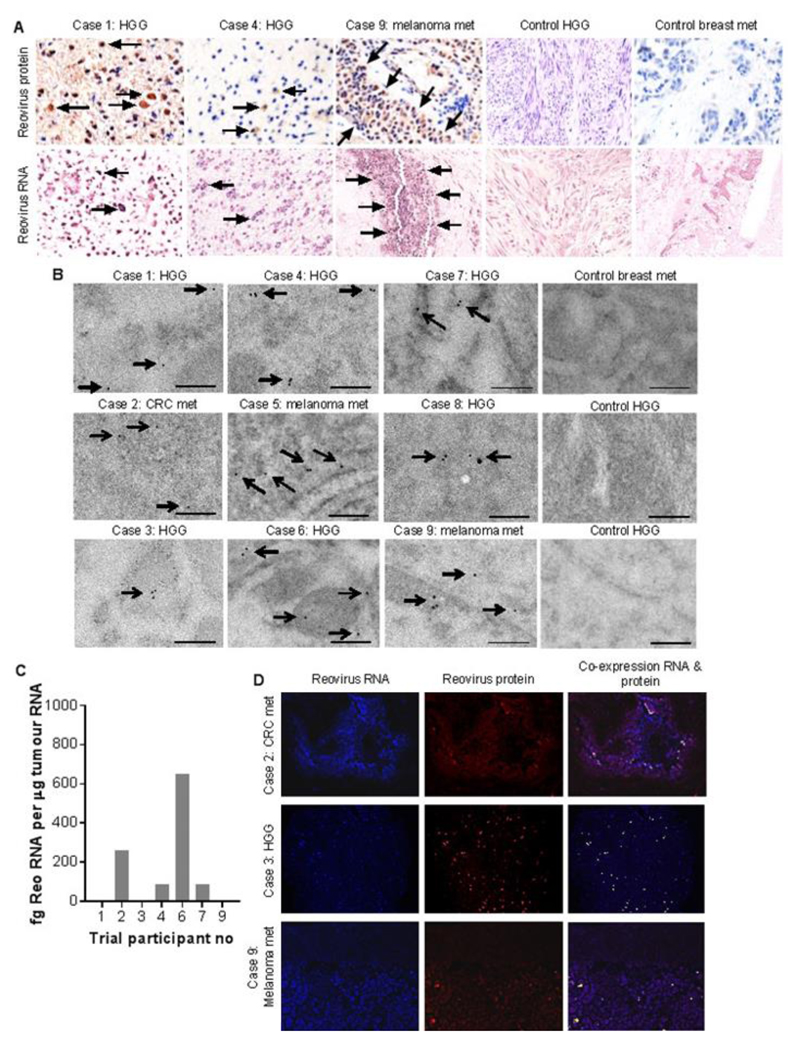
Fig. 1. Intravenous delivery of reovirus to primary and secondary brain tumors.
A) Representative IHC and ISH trial and control patient tumor sections stained for reovirus σ3 protein (brown - top row) and reovirus RNA (blue - bottom row). The ‘control breast met’ is a metastasis to the brain from a breast cancer primary. Arrows point to examples of positive cells / positive areas of tissue. Scale bars = 20 μm. B) Trial and control patient tumor immunogold-TEM images for reovirus σ3 protein (arrows). Scale bar = 200 nm. C) qRT-PCR for reovirus σ3 gene, using whole tumor RNA. Data indicate fg reovirus RNA per µg of whole tumor RNA. Histogram shows the mean of triplicate samples, and error bars indicate standard deviation. D) Representative IF of trial patient tumor sections showing staining for reovirus RNA (blue), reovirus σ3 protein (red), and their co-expression (yellow). Scale bars = 80 μm.

