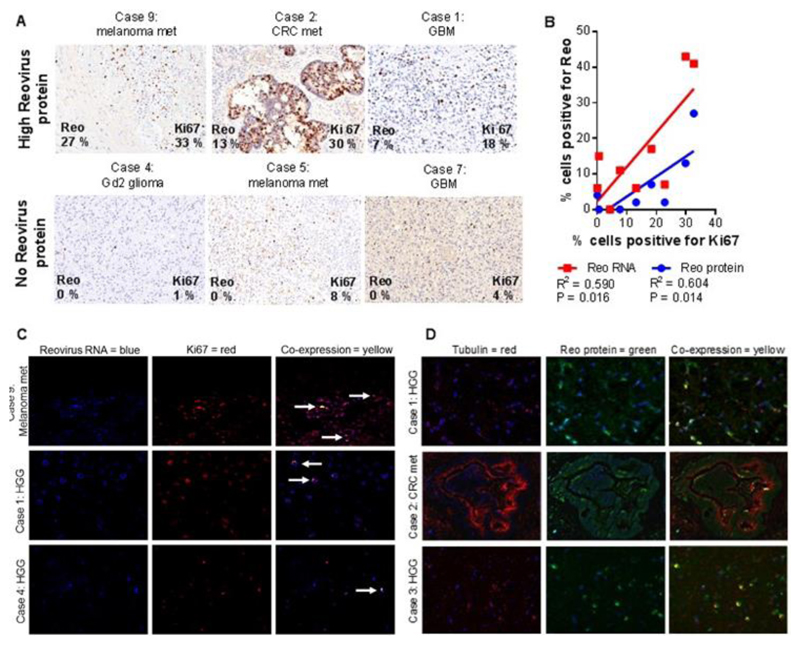
Fig. 2. Correlation of reovirus RNA / protein with proliferating tumor cells.
A) Trial patient IHC tumor sections stained for Ki67 (brown) with indicated percentages of cells positive for Ki67 and reovirus σ3 protein (from table S3), showing examples of tumors with high reovirus σ3 staining (top row) and no reovirus σ3 protein staining (bottom row). Scale bars = 40 μm. B) Scatter plot and line of best fit, correlating the percentages of tumor cells positive by IHC for reovirus RNA or σ3 protein and for Ki67. C) Representative tumor sections derived from trial patient nine (high Ki67, top row), trial patient one (intermediate Ki67, middle row), and trial patient four (low Ki67, bottom row), showing IF staining for reovirus RNA (blue), Ki67 (red), or their co-expression (yellow, arrows). Scale bars = 40 μm. D) Representative trial patient tumor IF staining for tubulin (fluorescent red), reovirus σ3 protein (fluorescent green) and their co-expression (yellow). Nuclear counterstaining is blue. Top and bottom row scale bars = 40 μm. Middle row scale bar = 80 μm.

