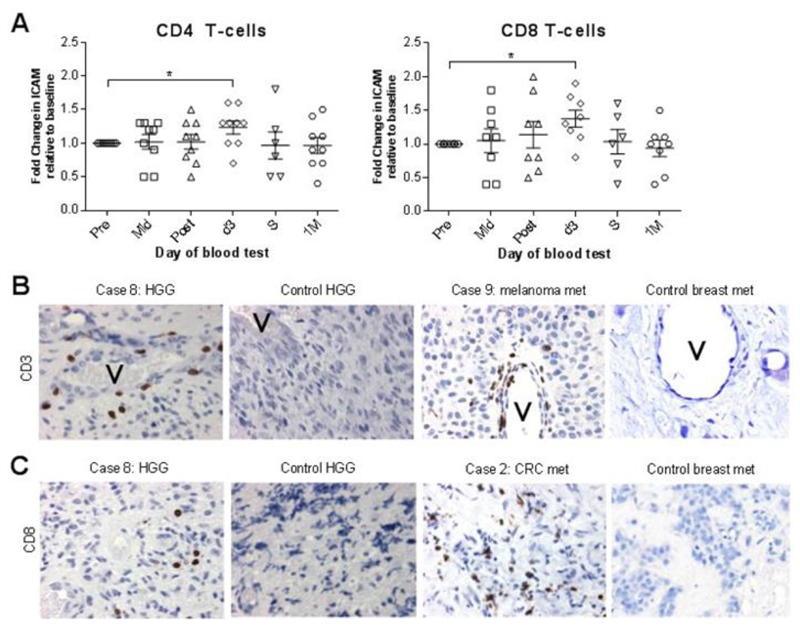
Fig. 3. Tumor immune cell infiltration.
A) Fold change in cell-surface ICAM expression on CD4 and CD8 T cells from trial patients’ peripheral blood. B) Trial and control patient IHC tumor sections stained for CD3 (brown). Scale bars = 20 μm. ‘V’ indicates blood vessel. C) Trial and control patient IHC tumor sections stained for CD8 (brown). Scale bars = 20 μm.

