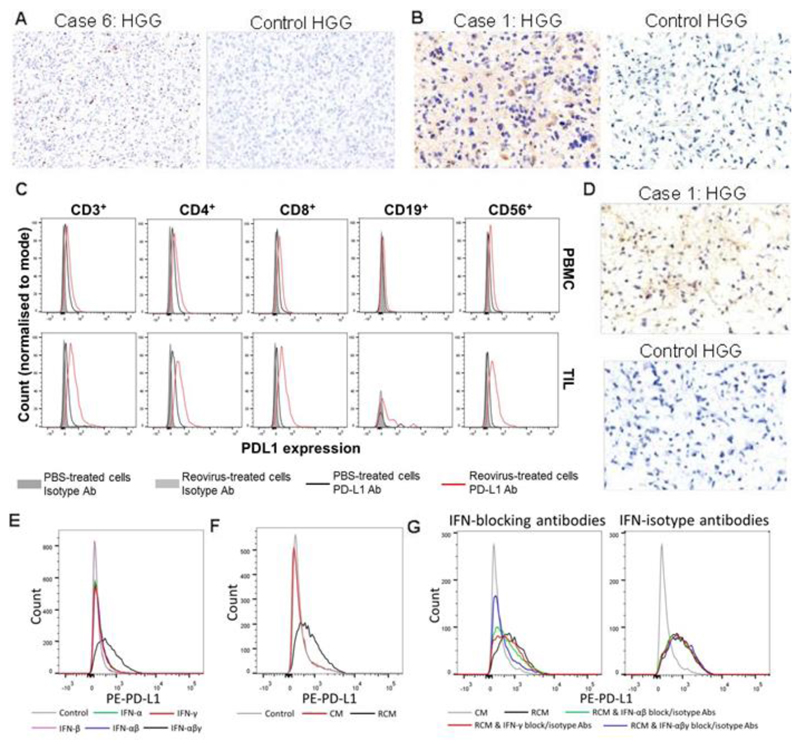
Fig. 4. Expression of cleaved caspase 3, PD-L1, and PD-1 in high grade gliomas after reovirus treatment.
A) Representative trial and control patient HGG sections stained for cleaved caspase 3 (brown) by IHC. Scale bars = 60 μm. B) Representative trial and control patient HGG sections stained by IHC for PD-L1 (brown). Scale bars = 30 μm. C) Representative (one of three samples tested) flow cytometry for PD-L1 on GBM TILs (bottom row) or PBMCs (top row) derived from the same patient, after stimulation for 48 hours using 1 PFU/cell reovirus. D) Representative trial and control patient HGG sections stained by IHC for PD-1 (brown). Scale bars = 30 μm. E) Representative flow cytometry for PD-L1 on GBM1 cells after stimulation with combinations of purified IFN-α/-β/-γ for 24 hr, each at 100 pg/ml. F) Representative flow cytometry for PD-L1 on GBM1 cells after stimulation with ex vivo HGG-derived CM or RCM for 24 hours (at a concentration of 1:4 of conditioned medium to native medium). G) Representative flow cytometry for PD-L1 on GBM1 cells after stimulation using PBMC-derived CM or RCM for 24 hours (at a concentration of 1:4 of conditioned medium to native medium) with blockade of IFN-α+β/γ/ α+β+γ or equivalent isotype controls.

