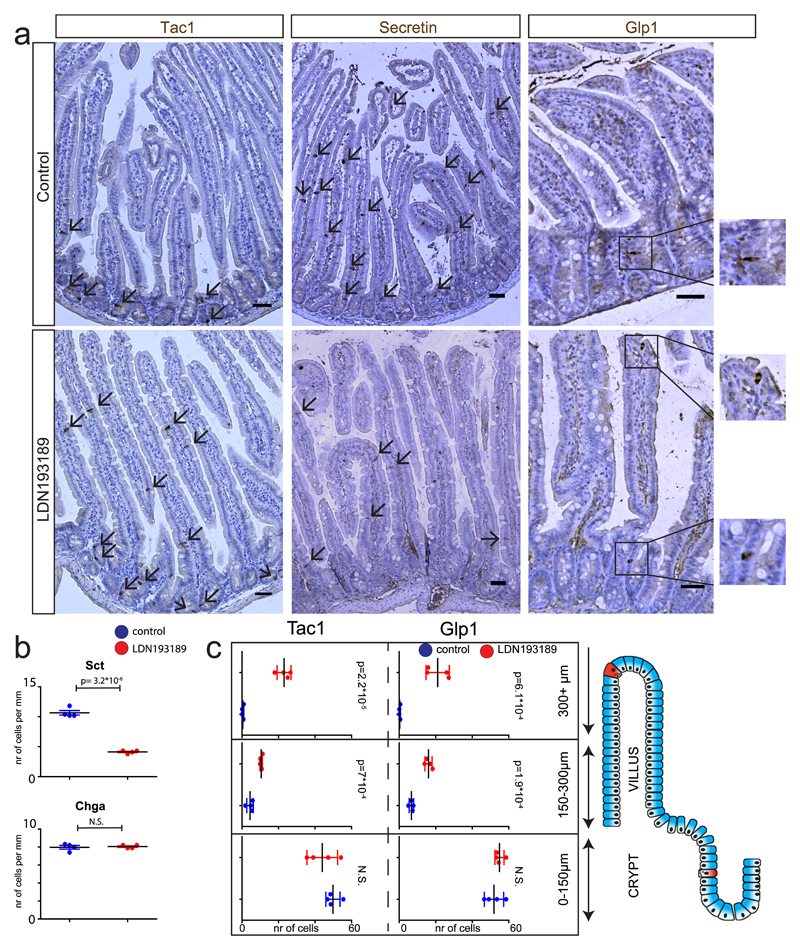
Fig. 4. Manipulation of BMP gradient alters hormone expression in mice.
a, Mice were treated for 80 hours with BMPr1a inhibitor LDN193819. Immunohistochemical analysis of the intestine shows a repression of Sct and induction of Glp1 and Tac1 expression upon BMP inhibition. Glp1+ and Tac1+ expressing cells are mostly restricted to the crypt in control mice, but expand into the upper villus region upon BMP inhibition. b, Quantification of a. Number of Chga+ and Sct+ positive cells per treatment. c, Quantification of a. Number of Tac1+ or Glp1+ cells are displayed for each segment of the crypt-villus axis in the different treatments. Cells positive for Tac1 and Glp1 increase in the higher villus segments upon LDN193189 treatment. Tac1+ cells are counted and displayed in 10mm of the proximal small intestine. Glp1+ cells are counted and displayed in 30mm of the distal small intestine. Results presented are derived from n=4 mice per treatment, and statistics were calculated using a two-sided t-test. Mean values per staining and treatment are shown, and error bars present SD. Scale bar is 50 µm.

