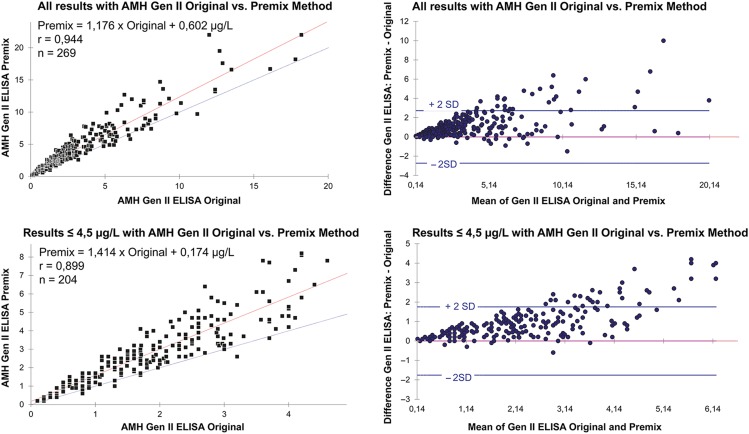
Figure 1.
Comparison of the results from the Beckman Coulter AMH Gen II ELISA, using the Original method and the modified Premix method. The upper charts show all anti-Müllerian hormone (AMH) results (up to about 20 μg/l) and the charts below show results where the Original method concentrations are up to 4.5 μg/l (corresponding to an average of about 6.5 μg/l with the Premix method). The left panels represent the linear least squares regression plots and the right panels represent the Bland–Altman plots. r = correlation coefficient; n = number of samples.

