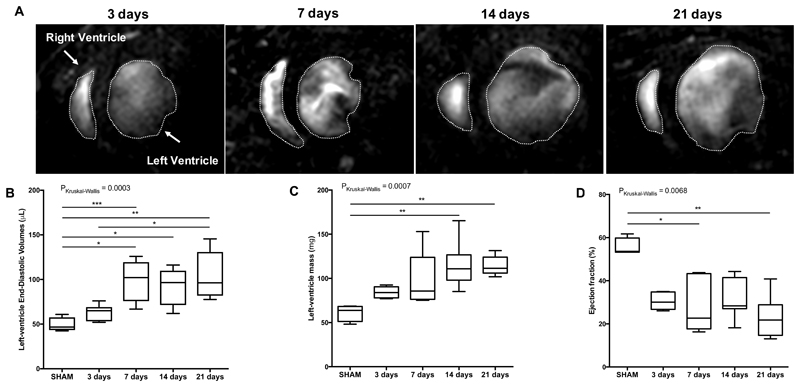
Figure 2.
Functional and volumetric parameters of the heart at 3,7,14 and 21 days post-MI and SHAM-operated mice. (A) Representative anatomical short-axis images of the heart. Myocardium is depicted in orange; the star indicates myocardial wall thinning at day 21. (B) Left ventricular end-diastolic volume progressively dilates from acute to late stages of MI. (C) Increasing Left ventricular mass and (D) decreasing Ejection fraction were observed over time. N=8 MI animals/time-point, N=4 SHAM-operated animals/time-point. MI: myocardial infarction. *P<0.05, **P<0.01.

