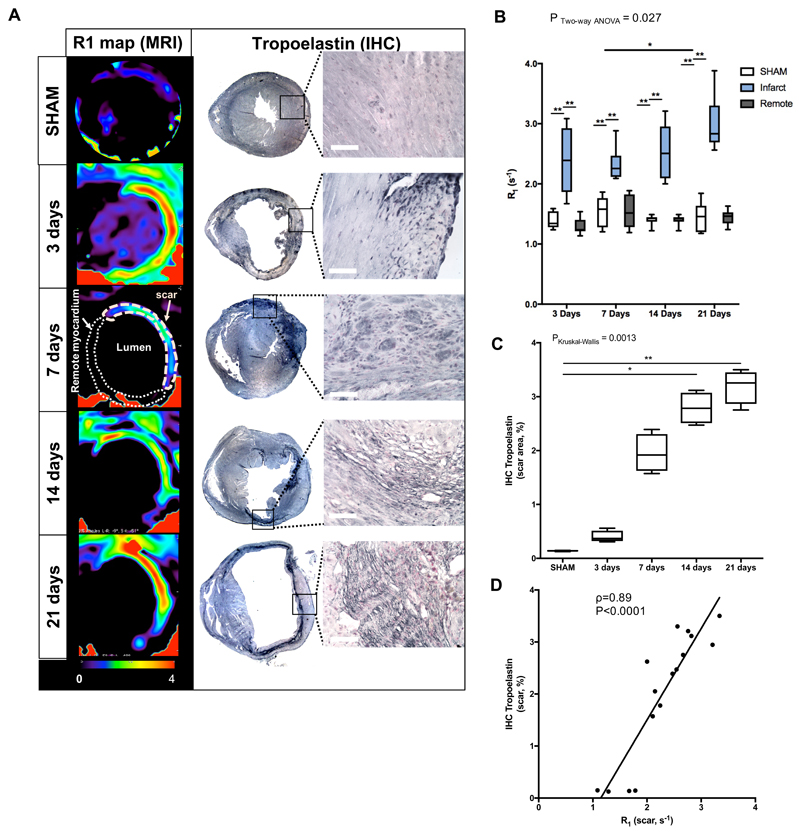
Figure 5.
In vivo imaging of extracellular matrix remodeling after myocardial infarction with a gadolinium-based elastin/tropoelastin-specific contrast agent. (A) Representative short-axis images of relaxation rate (R1, left columns) maps and tropoelastin IHC (right columns) of the hearts sections at 7, 14 and 21 days post-MI at 3T MRI. Tropoelastin fibers were identified as black fine fiber network. (B) Quantification of the R1 in the infarct, remote myocardium (N=8/time-point) and in SHAM-operated animals (N=6 per time-point). R1 values increased significantly from 7 to 21 days post-MI. (C) IHC quantification, showing a significantly increase in tropoelastin fibers from 7 to 21 days post-MI (N=4/time point. N=3 SHAM, PKruskal-Wallis SHAM vs 21days<0.01). (D) Correlation between ex vivo measurements of tropoelastin IHC and in vivo R1 values of the scar. Spearman correlation (N=16, ρ=0.89, P<0.0001). IHC:immunohistochemistry. Scale bar, 50μm. *P<0.05,**P<0.01,***P<0.001.

