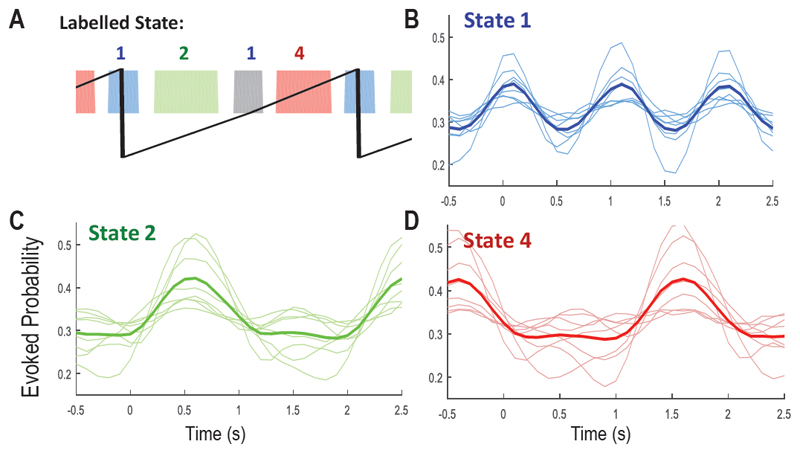
Figure 9.
Evoked probabilities aligned to the right heel strikes for State 1 (B), 2 (C) and 4(D) for all subjects, compared to the labelled states (A). In plot B-D, time 0 is the timing of right heel strike, thin lines showing the evoked probabilities from individual subjects. Thick lines show the average across all patients.

