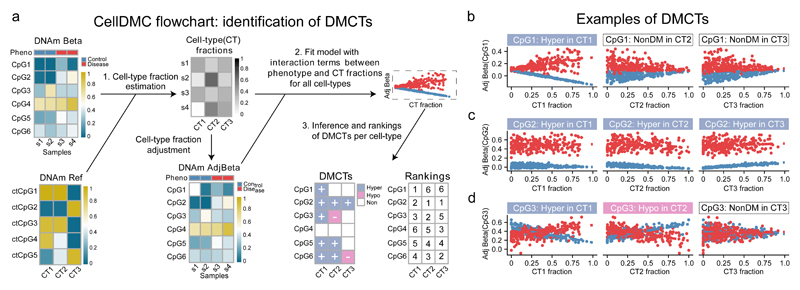
Figure 1. Identification of differentially methylated cell-types (DMCTs) using CellDMC.
a) For a given DNAm data matrix, CellDMC uses a reference DNAm matrix encompassing major cell-types (CTs) in the tissue of interest, to estimate cell-type fractions in each sample, subsequently adjusting the DNAm data matrix for these estimated fractions. It then fits statistical models adjusting for cell-type fractions, that include interaction terms between the phenotype and estimated cell-type fractions to identify DMCs in specific cell-types (DMCTs). These can then be ranked according to statistical significance in each cell-type. b,c,d) Scatterplots of adjusted beta-values against cell-type fraction for 3 different types of DMCTs. b) A DMCT (CpG1) which is hypermethylated in cell-type CT1 but not in cell-types CT2 and CT3. c) A DMCT (CpG2) hypermethylated in all three cell-types. d) A DMCT (CpG3) occurring in two cell-types (CT1 & CT2) but with DNAm changes occurring in opposite direction (hypermethylated in CT1, hypomethylated in CT2).

