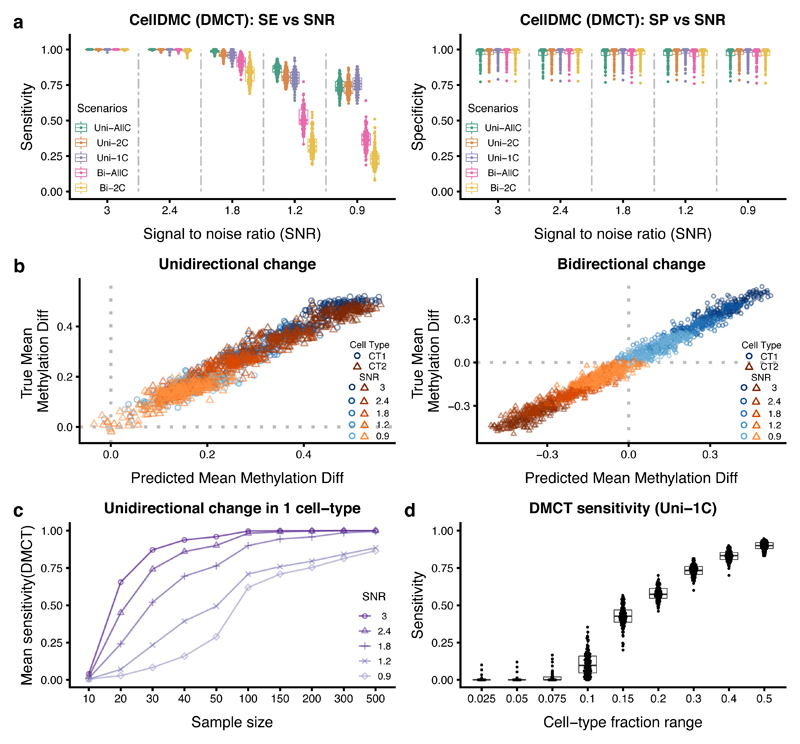
Figure 2. Validation of CellDMC on simulated data.
a) Sensitivity (SE) and specificity (SP) (y-axis) of CellDMC to detect DMCTs in five different scenarios and for five different SNRs (x-axis). The scenarios correspond to uni-directional DNAm changes being unique to one cell-type (Uni-1C), shared by two cell-types (Uni-2C) or occurring in all cell-types (Uni-AllC), and to bi-directional changes (i.e hypermethylated and hypomethylated) in two cell-types (Bi-2C) or all cell-types (Bi-AllC). SNR values range from SNR~3 (mean DNAm difference in affected cell-types of approx. 0.4 to 0.5) to SNR < 1 (mean DNAm difference ~ 0.1). Each box contains 100 data points from 100 Monte-Carlo runs. Boxes indicate 25th and 75th centiles. Whiskers extend to the largest values no further than 1.5IQR from these centiles where IQR=inter-quartile range. b) Scatterplots of the true DNAm difference in affected cell-types (y-axis) versus the predicted DNAm difference from CellDMC (x-axis) for the uni-directional (left panel) and bi-directional (right panel) cases. Data points are shown for 100 DMCs, 2 affected cell-types (CT1 and CT2) and for five SNR levels. c) Sensitivity to detect DMCTs as a function of total sample size (numbers of cases and controls are each 100) for five different SNR values in the Uni-1C scenario. Each data point represents the mean over 100 Monte-Carlo runs. d) Sensitivity to detect DMCTs as a function of the cell-fraction range exhibited by the affected cell-type in a mixture of three cell-types. Each boxplot derives from 100 data points (100 Monte-Carlo runs). Boxes indicate 25th and 75th centiles. Whiskers extend to the largest values no further than 1.5IQR from these centiles where IQR=inter-quartile range.

