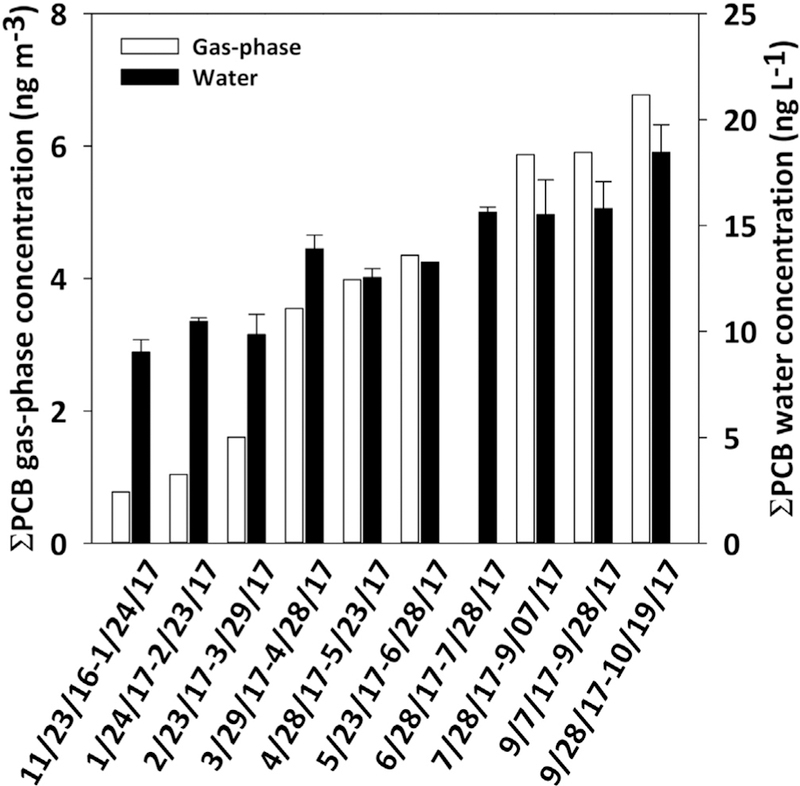
Fig. 1.

Concentrations of gas-phase (white bars) and mean freely-dissolved water (black bars) of ƩPCBs at IHSC. X-axis indicates the deployment time. Errors bars from the freely-dissolved water bar plots represent the standard deviation of at least two samples collected at the same time. PUF-PAS from 6/28/17e7/28/17 was lost.
