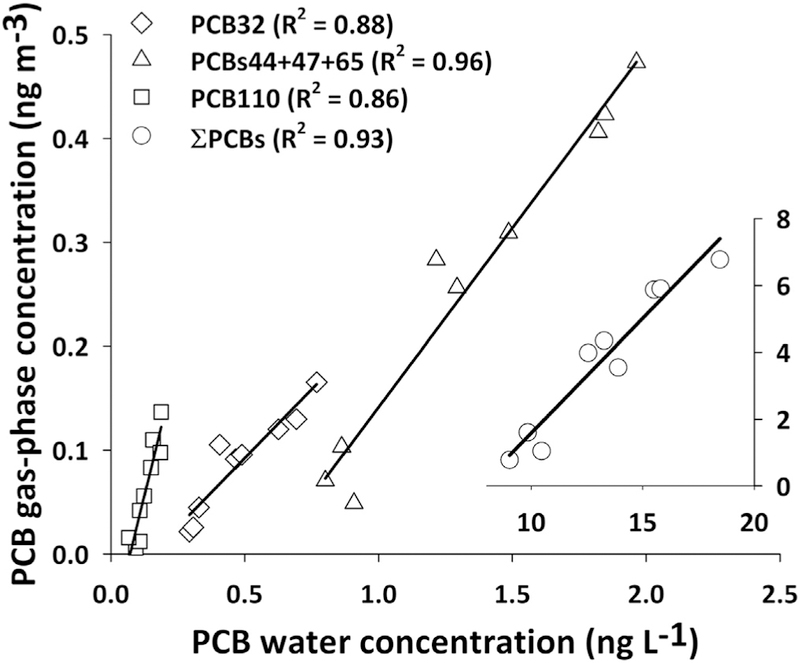
Fig. 2.

Gas-phase and freely-dissolved water concentrations for ƩPCBs and selected congeners. Insert plot represents ƩPCBs. Data are from the nine deployments. All correlations are statistically significant (p < 0.05).

Gas-phase and freely-dissolved water concentrations for ƩPCBs and selected congeners. Insert plot represents ƩPCBs. Data are from the nine deployments. All correlations are statistically significant (p < 0.05).