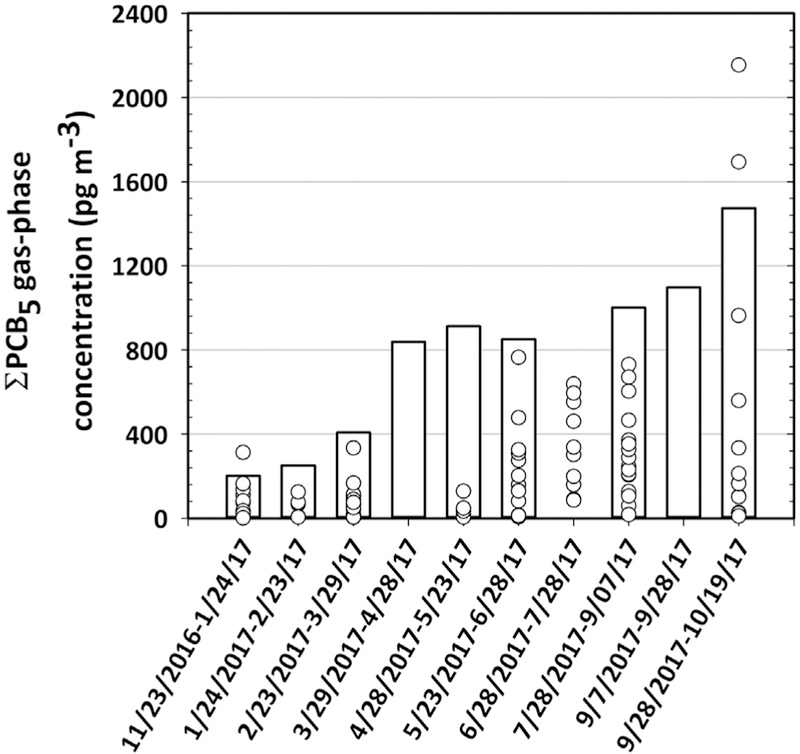
Fig. 3.

Concentrations of gas-phase of ƩPCB5 (i.e., PCBs8, 15, 18, 28 and 31) from our PUF-PAS samples (cyan bars) and active sampling from the Army Corps of Engineers (void circles). The active samplers were obtained from five locations nearby our sampling location. Source: http://web.ead.anl.gov/inharbor/data/analysis/publicTables/index.cfm.
