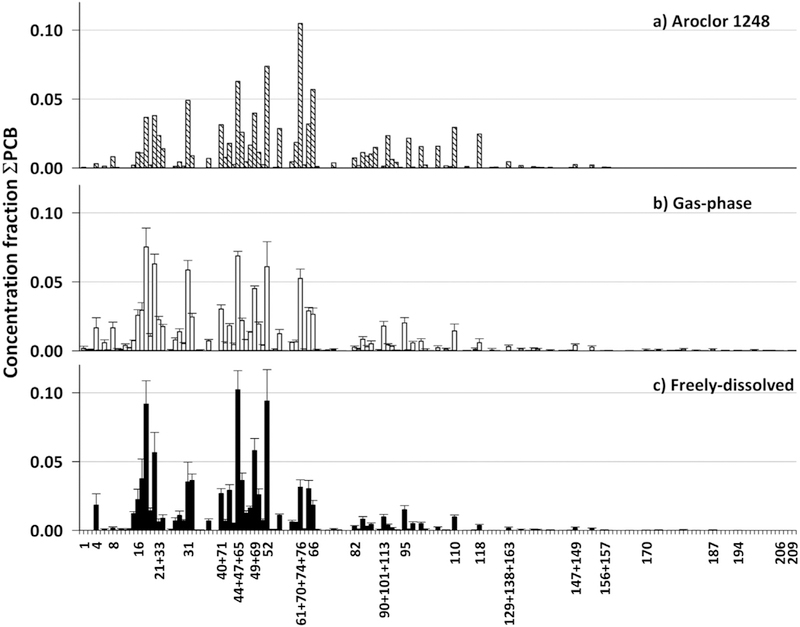
Fig. 4.

Mean individual PCB congener profile of (a) Aroclor 1248, (b) gas-phase (n = 9) and (c) freely-dissolved samples (n = 23). Each congener was normalized to the total concentration of PCBs in the sample. The error bars represent one standard deviation above the mean.
