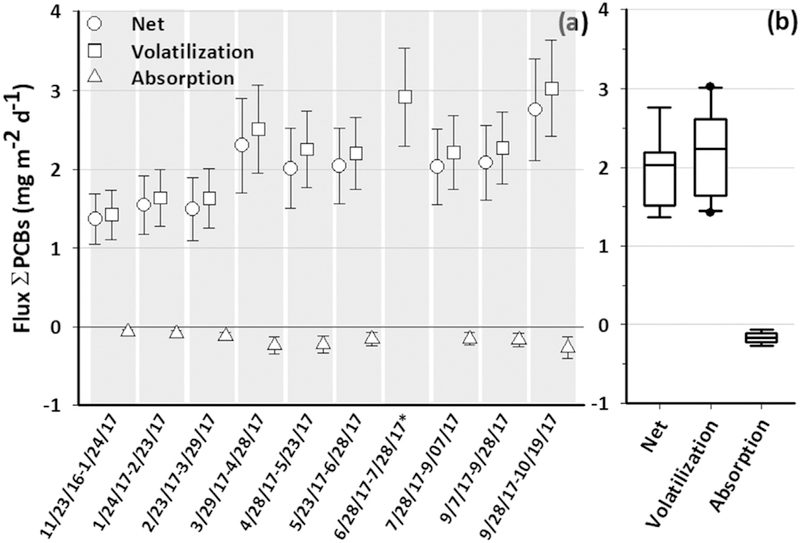
Fig. 5.

Average net fluxes (grey circles), volatilization (cyan circles) and absorption (blue circles) of ΣPCBs in μg m2 d−1 for the sampling periods (a). Error bars in plot (a) represent the 2.5th and 97.5th percentiles calculated from the Monte Carlo simulations. Net and absorption from 6/28/17–7/28/17* were not calculated due to loss of air sample. Plot (b) summarizes the average net, volatilization and absorption fluxes for the ten sampling periods via box plots, describing from top to bottom the maximum, 75th percentile, median, 25th percentile and the minimum value.
