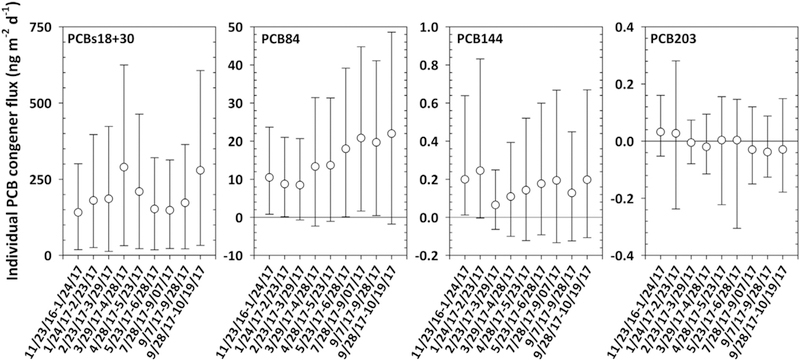
Fig. 6.

Selected PCB congeners net fluxes (PCBs18 + 30, 84, 144 and 203) for the nine deployments. Void circles represent the measure values and the error bars represent the 2.5th and 97.5th percentiles (i.e., 95% confidence interval). Monte Carlo simulations were run 1000 times. Net flux from deployment 6/28/17–7/28/17 was not calculated due to loss of PUF sample. Please note the difference in the y-axis scales.
