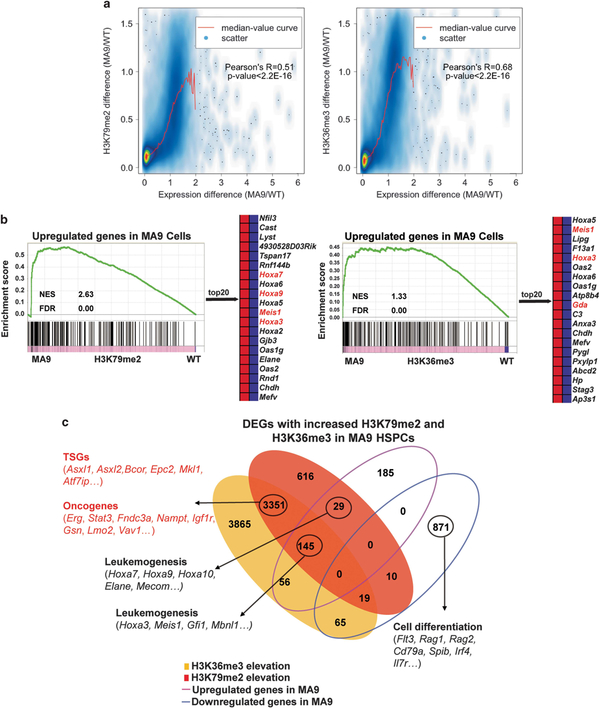
Figure 2.
Gene dysregulation in MA9 HSPCs with increased H3K79me2 and H3K36me3 levels. (a) The correlation between H3K79me2 and H3K36me3 differences and expression changes in MA9 compared to WT HSPCs. Pearson’s correlation and two-tailed Student’s t-test (P-value) were calculated. (b) GSEA showing enrichment of upregulated genes at genome-wide gene body H3K79me2 and H3K36me3 ChIP signals respectively. MLL-AF9 targets are shown in red, non-targets are shown in black (NES: normalized enrichment score). (c) Venn diagram of differentially expressed genes (DEGs) with altered H3K79me2 or/and H3K36me3 occupancies. Genes in red show genes with no significant expression change, but were co-enriched with increased H3K79me2 and H3K36me3. See also Supplementary Tables S1 and S2.

