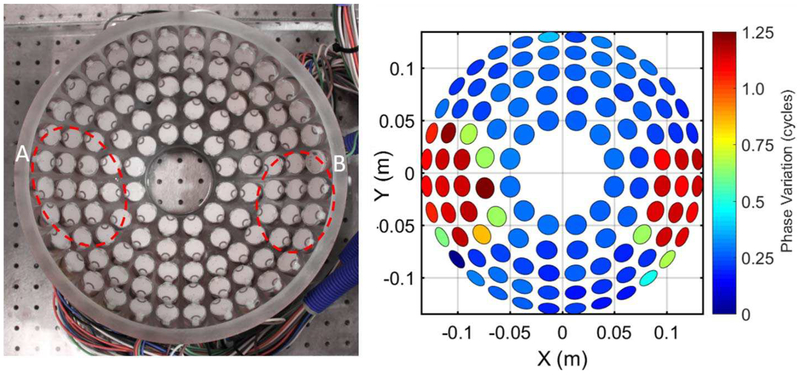
Fig. 6.
Picture of histotripsy array (left) with areas covered by acrylic discs outlined and phase projection (right) of ACE emission signal arrival time difference between disk phantom and free field measurements illustrating the resulting phase aberration. Both disc phantoms were circular with a thickness of 6.35 mm. Diameters of discs A and B were 152.4 mm and 101.6 mm, respectively.

