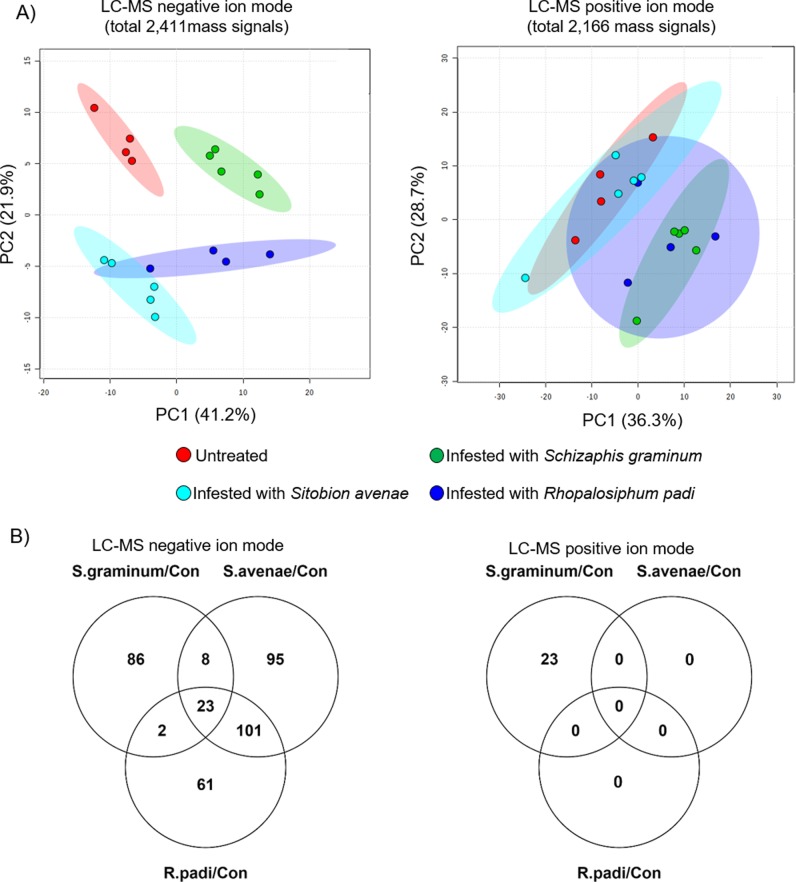
Fig 2. An untargeted metabolic overview of durum wheat infested with S. graminum, S. avenae and R. padi for 96 hr.
A) PCA plots of features from negative (2,411 ESI) and positive (total 2,166 ESI) ion modes illustrated by using Metaboanalyst software (n = 4–5). B) Venn diagram illustrating the number of total features significantly up- or down-regulated by cereal aphid treatment; negative ion mode (left) and positive ion mode (right). P value < 0.05 FDR and fold change > 2 or < 0.5.

