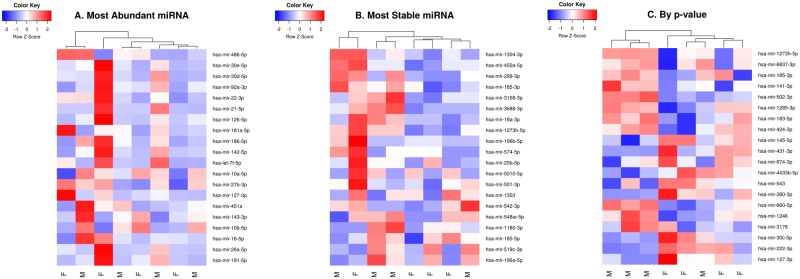
Fig 5. Heatmap of log-CPM values for top 20 miRNAs ranked by: A: Most abundant, B: Most stable and C: By p-value following differential expression analysis.
Expression across each miRNA has been scaled so that mean expression is zero and standard deviation is one. Samples with relatively high expression of a given miRNA are marked in red and samples with relatively low expression are marked in blue. Lighter shades and white represent genes with intermediate expression levels. Samples and genes have been reordered by the method of hierarchical clustering. A dendrogram is shown for the sample clustering.

